- Altcoin resumed its decline, approaching a month-long consolidation range that it previously broke out of.
- Technical indicators revealed a strongly bearish market
Following a week-long downturn, one during which the altcoin dropped significantly by 15.22%, AXS market bulls made a comeback. Their efforts pushed the asset up by 10.22% in the last 24 hours, offering a glimmer of hope.
However, further analysis by AMBCrypto suggested that Axie Infinity [AXS] remained bearish at press time. In fact, the prevailing downturn could deepen, with the altcoin likely to fall further on the charts now.
A return to consolidation
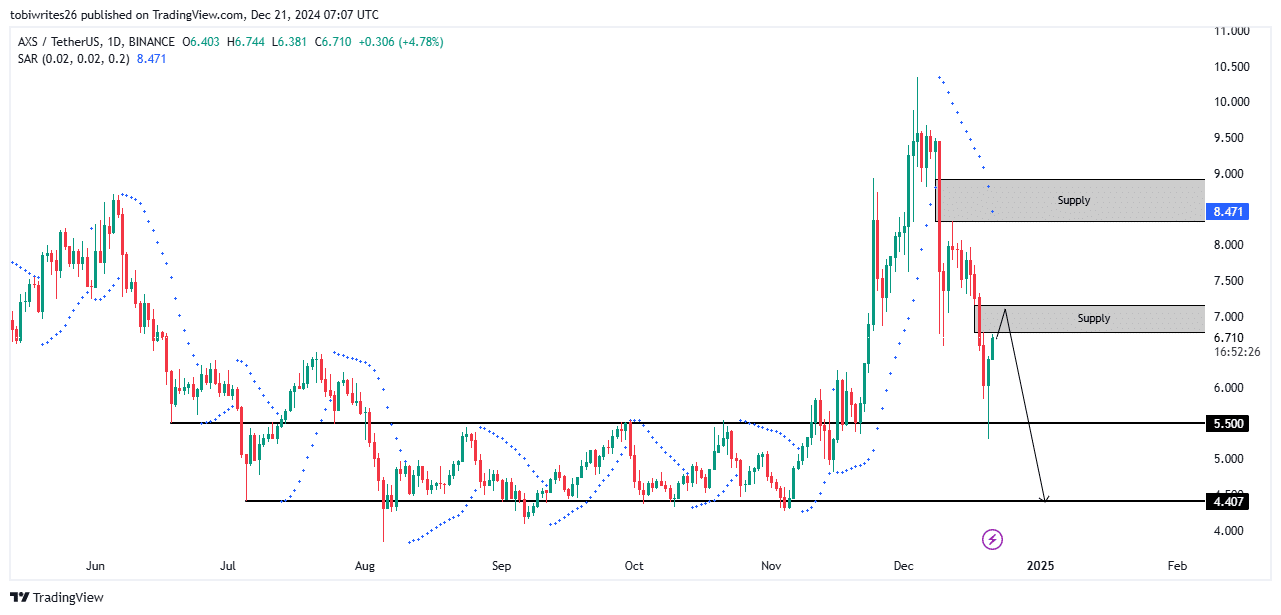
AXS has been on a steep decline lately, losing 48.67% of its value between 4 December and 20 December. Its latest daily gains followed a rebound off a resistance zone—now acting as support. At the time of writing, the altcoin seemed to be heading back towards the lower consolidation range.
However, this bounce brought AXS into a supply zone between $6.78 and $7.156, where strong selling pressure could push the price lower.
AMBCrypto’s analysis suggested that if the selling pressure intensifies, AXS may re-enter the consolidation phase it exited in November, leading to further price declines.
On the other hand, if the supply zone fails to hold, the asset could rise to another higher supply zone before resuming its downward trajectory.
AMBCrypto’s technical analysis reaffireds the prevailing bearish trend, pointing to sustained weakness in the market.
Bears take control
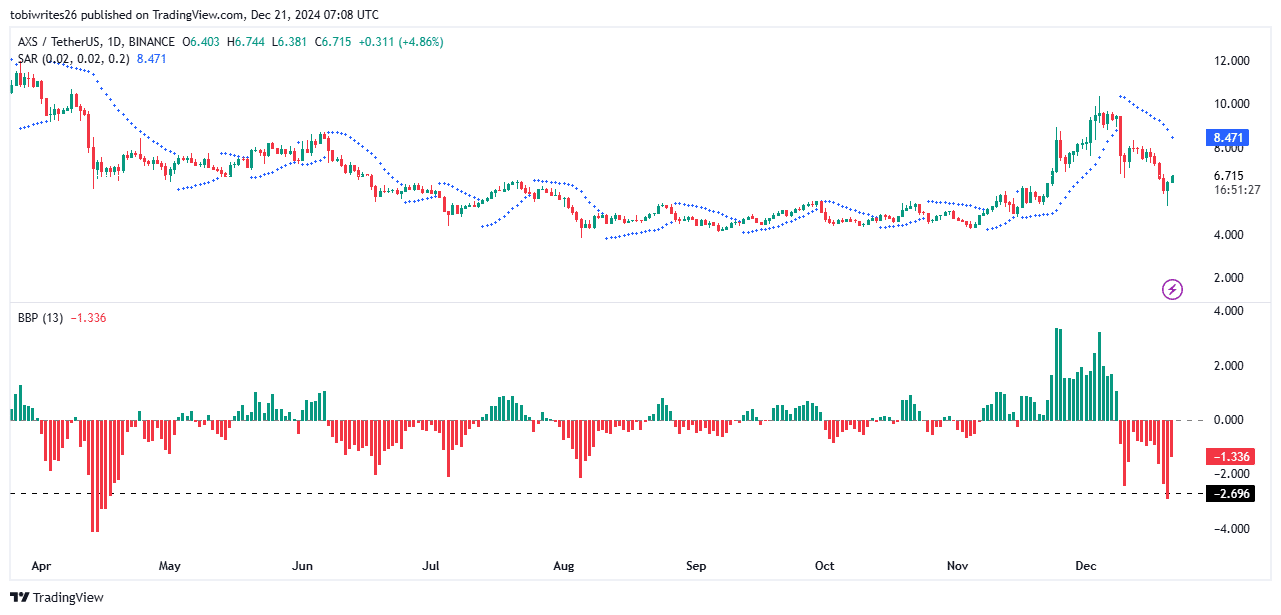
At press time, AXS remained under significant bearish pressure. The Bull Bear Power (BBP) indicator, which evaluates market control, showed that market bears have been driving the ongoing price drop.
Momentum indicators revealed a sharp hike in selling activity too, with the momentum bar hitting its lowest level since April 2022. This downward trend continued with another drop in the bar.
Similarly, the Parabolic SAR (Stop and Reverse) indicator formed above the asset’s price, marked by dotted markets on the chart. This formation alluded to intense selling pressure, suggesting a further decline in AXS’s price.
If these indicators maintain their current trajectory, the downward movement from the supply zone could accelerate, leading to even steeper price declines.
Selling pressure from derivatives traders
Finally, derivative traders have been increasingly selling their AXS positions, as both the Funding Rate and Open Interest started to decline.
The Funding Rate—which measures market control through periodic fees paid to maintain price levels in the spot and derivative markets—indicated that short sellers have been dominating.
In fact, the Funding Rate dropped into negative territory with a reading of -0.0253% – A sign of bearish market sentiment.
Additionally, Open Interest also fell, falling by 2.53% to $56.12 million. This decline suggested that short contracts now outnumber long positions, potentially amplifying downward pressure on AXS’s price.
If these trends persist, the bearish momentum in the derivatives market could further drive the asset’s value lower.


