- Solana has a strongly bullish market structure.
- Trading volume and momentum have been sizeable as SOL breached the range high.
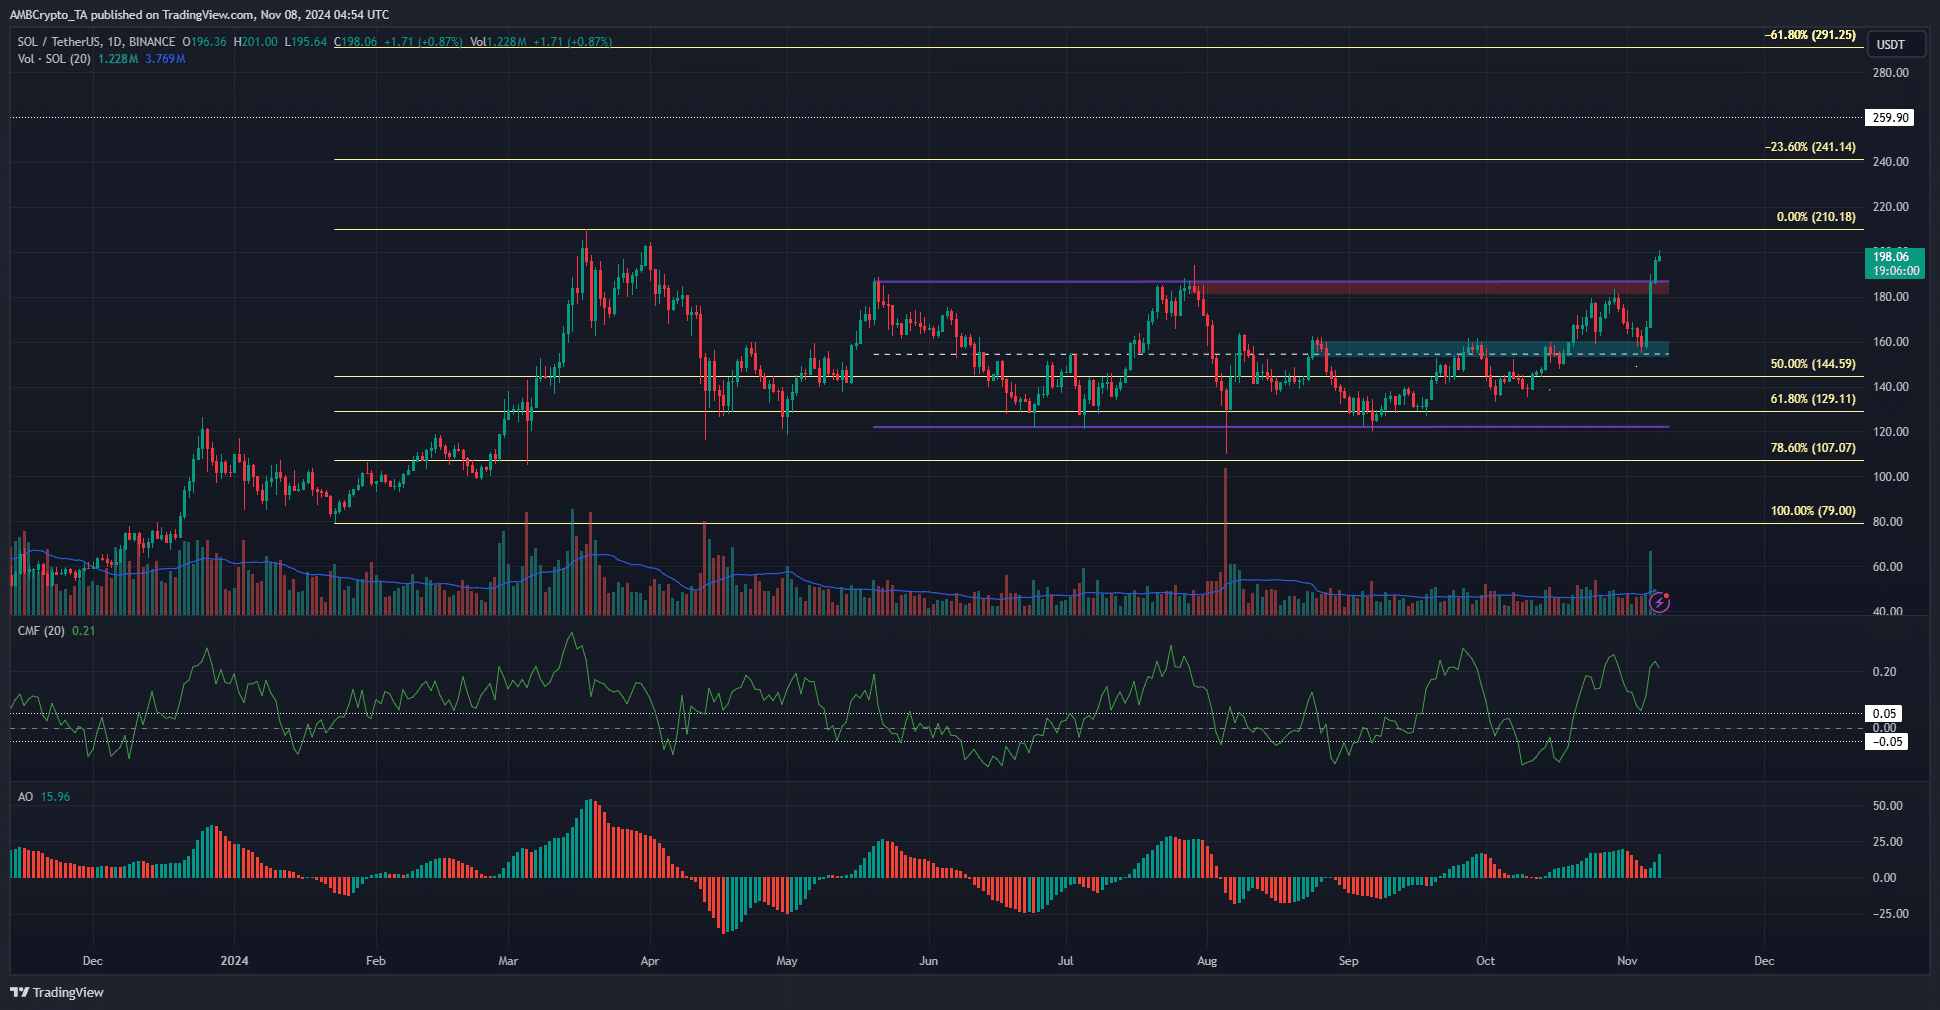
Solana [SOL] had traded within a range between $122 and $187 for nearly six months, but has successfully broken out above the range. The altcoin targets $290 long-term as the all-time high stands at $259.96.
Solana’s gains outpaced both Ethereum [ETH] and Bitcoin [BTC] over the past week. It is expected to trend upward, with a potential pullback toward $184 in the coming days.
Solana price prediction shows another 21% move higher is likely
The range breakout was a strongly bullish scenario and it occurred on high trading volume. The CMF was at +0.21 to show significant capital flows into the SOL market. Taken together, it was a firmly bullish sign for Solana.
The Fibonacci levels based on the February and March rally showed that the next bullish targets are $241 and $291. The bullish euphoria in the market could see sizeable pullbacks, but Solana is primed for a long-term uptrend.
The Awesome Oscillator has remained above zero for the most part of the past six weeks, showing momentum was on the buyers’ side. Therefore, further gains are expected. The 2024 high at $210 could oppose the bullish trend.
Can Solana breeze past the $210 resistance?
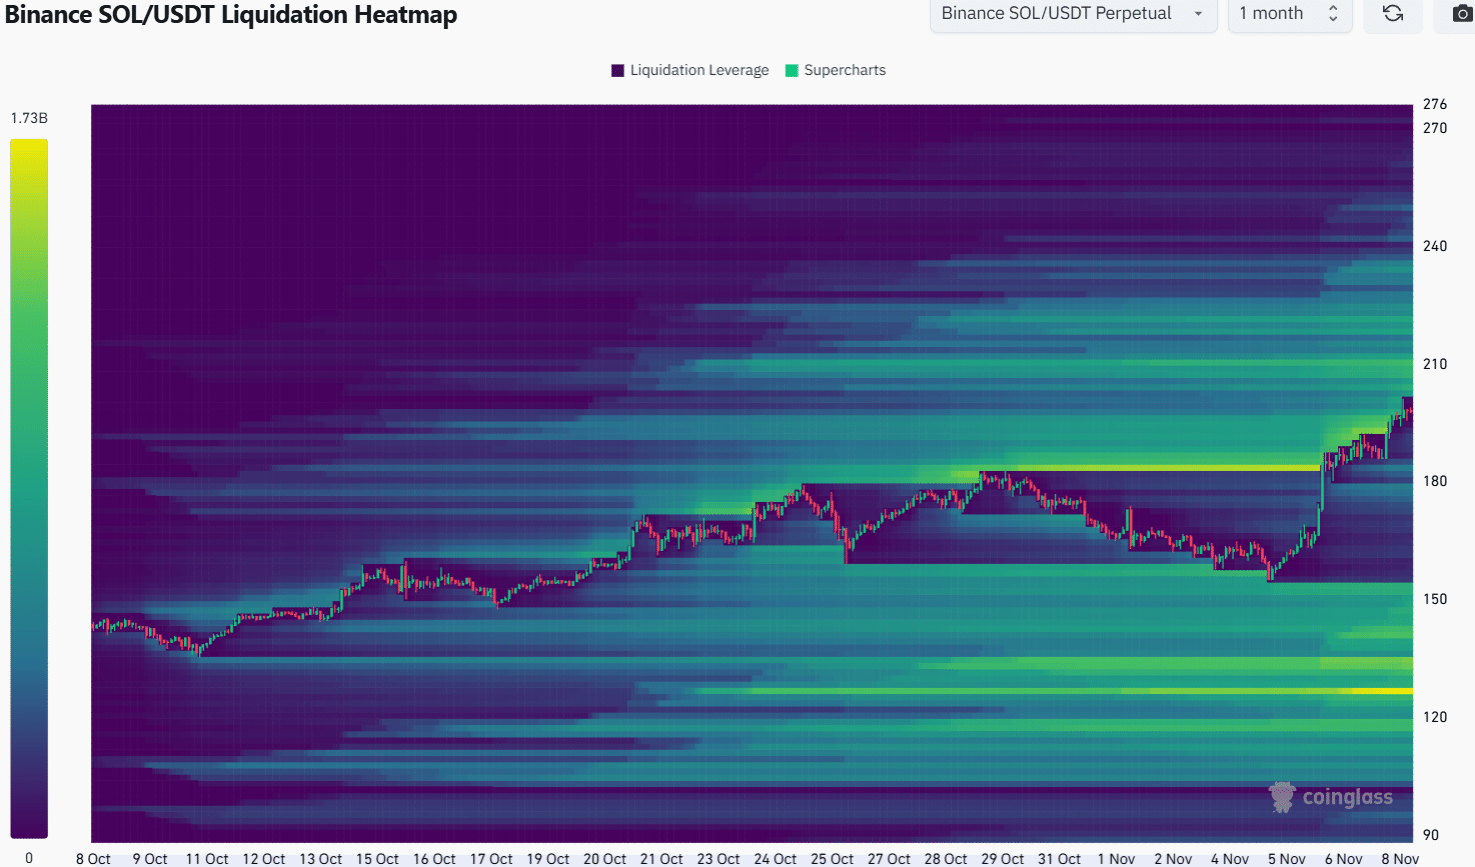
The 1-month look-back period liquidation heatmap showed a cluster of liquidation levels between $202 and $225. Hence, the area is likely to stall Solana buyers for a while, and could also force a short-term trend reversal.
To the south, significant liquidity was present at $150. A pullback so far south appeared unlikely, with Bitcoin trading above $70k.
Read Solana’s [SOL] Price Prediction 2024-25
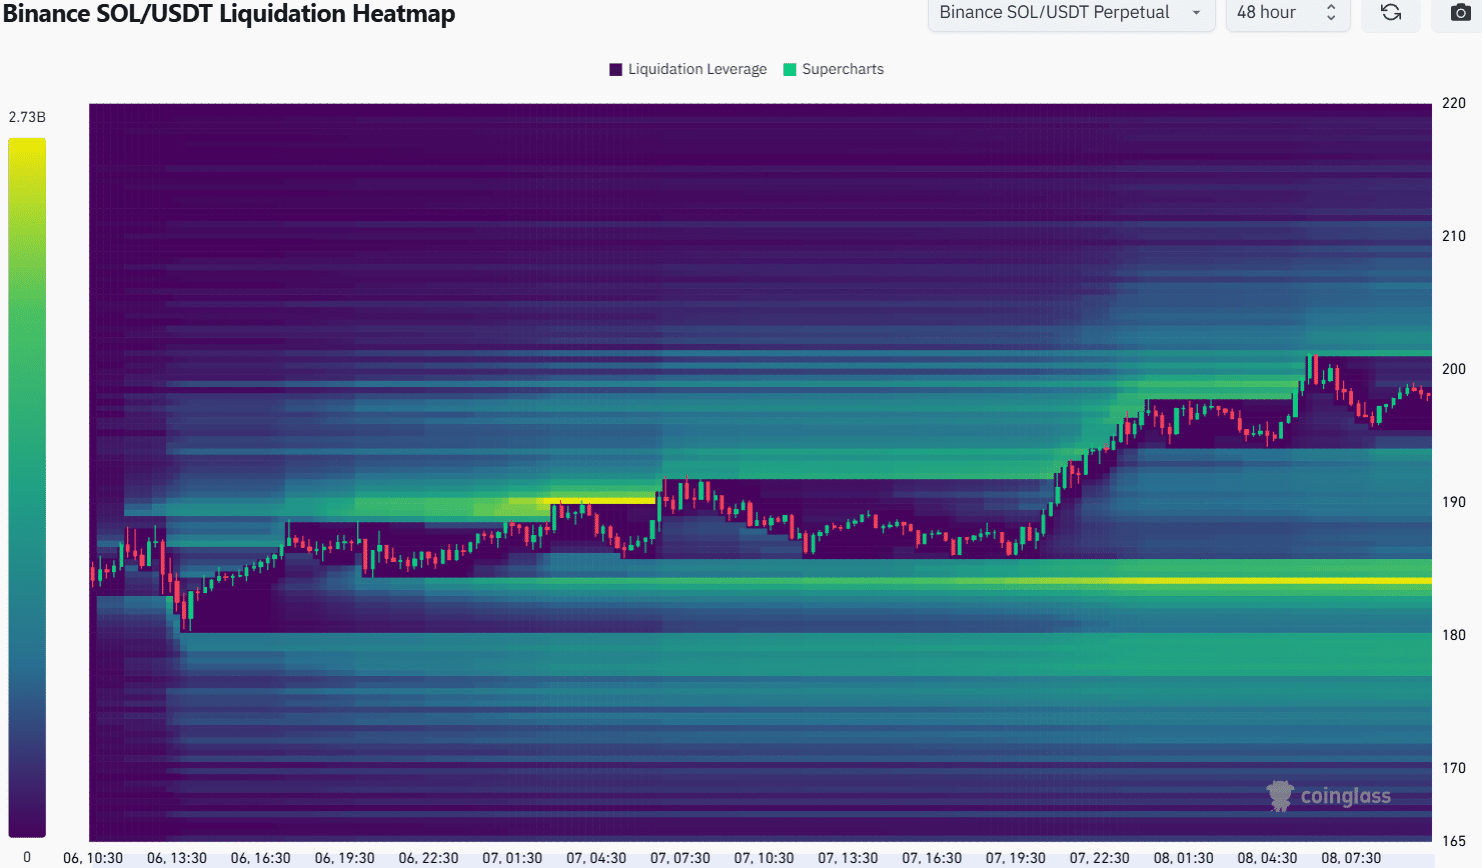
A look at the 48-hour heatmap underlined the $184 level as a short-term magnetic zone. It could attract prices toward it before a move higher.
Hence, a retest of the $180-$190 area should be regarded as a buying opportunity.
Disclaimer: The information presented does not constitute financial, investment, trading, or other types of advice and is solely the writer’s opinion


