- Render shows potential for a bullish reversal as it nears critical resistance at $6.63.
- Market sentiment leans bullish, backed by a long-short ratio favoring longs and high trading volume.
Render [RNDR] continues to assert its dominance in the decentralized physical infrastructure network (DePIN) sector with a formidable $2 billion market cap and an impressive $103 million in daily trading volume.
At press time, Render trades at $4.89, down by 4.18% over the past week. However, signs point towards a potential reversal, as Render’s technical and market metrics attract heightened investor interest.
Could this be the turning point that leads Render towards a bullish breakout?
RNDR price action analysis: Key levels to watch
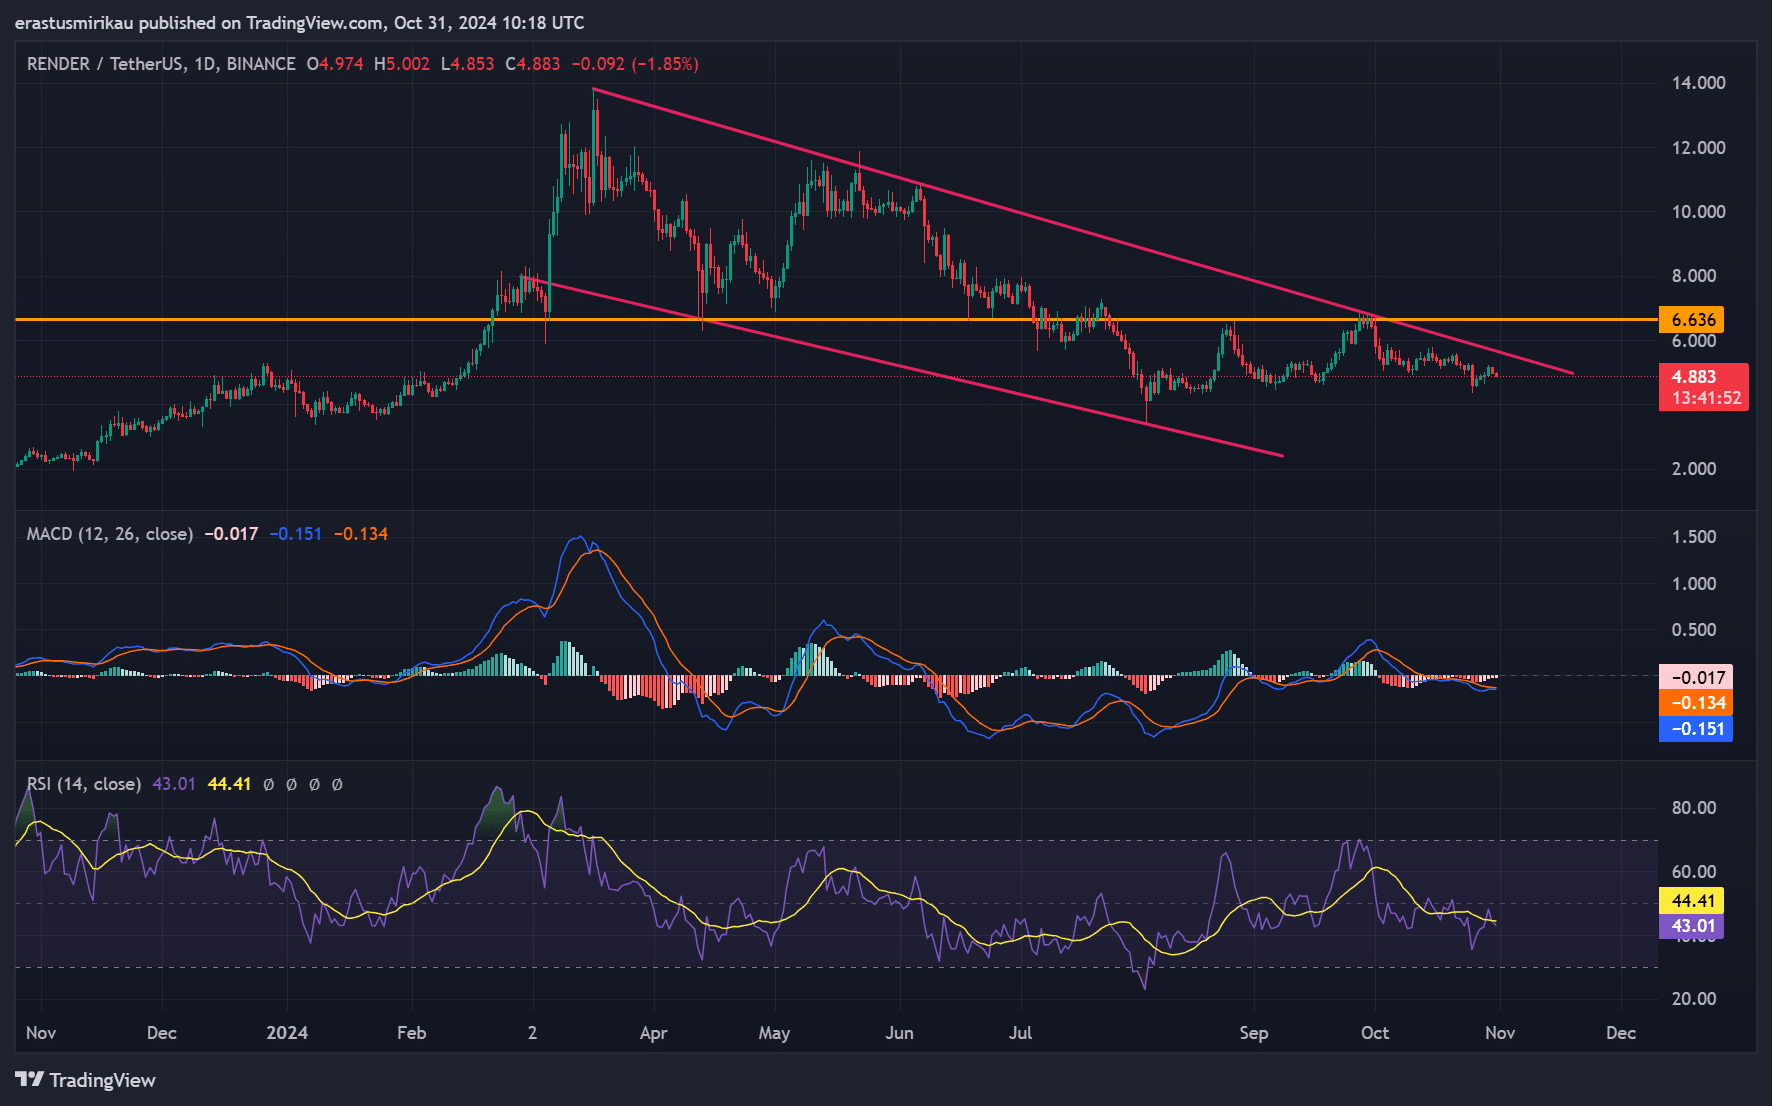
The price chart reveals a consolidation within a descending channel. The critical resistance level at $6.63 acts as a formidable barrier.
Therefore, a decisive break above this level could signal a bullish reversal. Analyzing the MACD, there’s a convergence pattern forming, which hints at easing selling pressure.
Additionally, the RSI currently sits at 43.01, slightly below neutral, suggesting that while bears maintain control, there may be room for buyers to step in.
If Render gains momentum, it could push toward the $6.63 resistance, setting the stage for a potential uptrend.
RNDR price DAA divergence: Warning signs or opportunity?
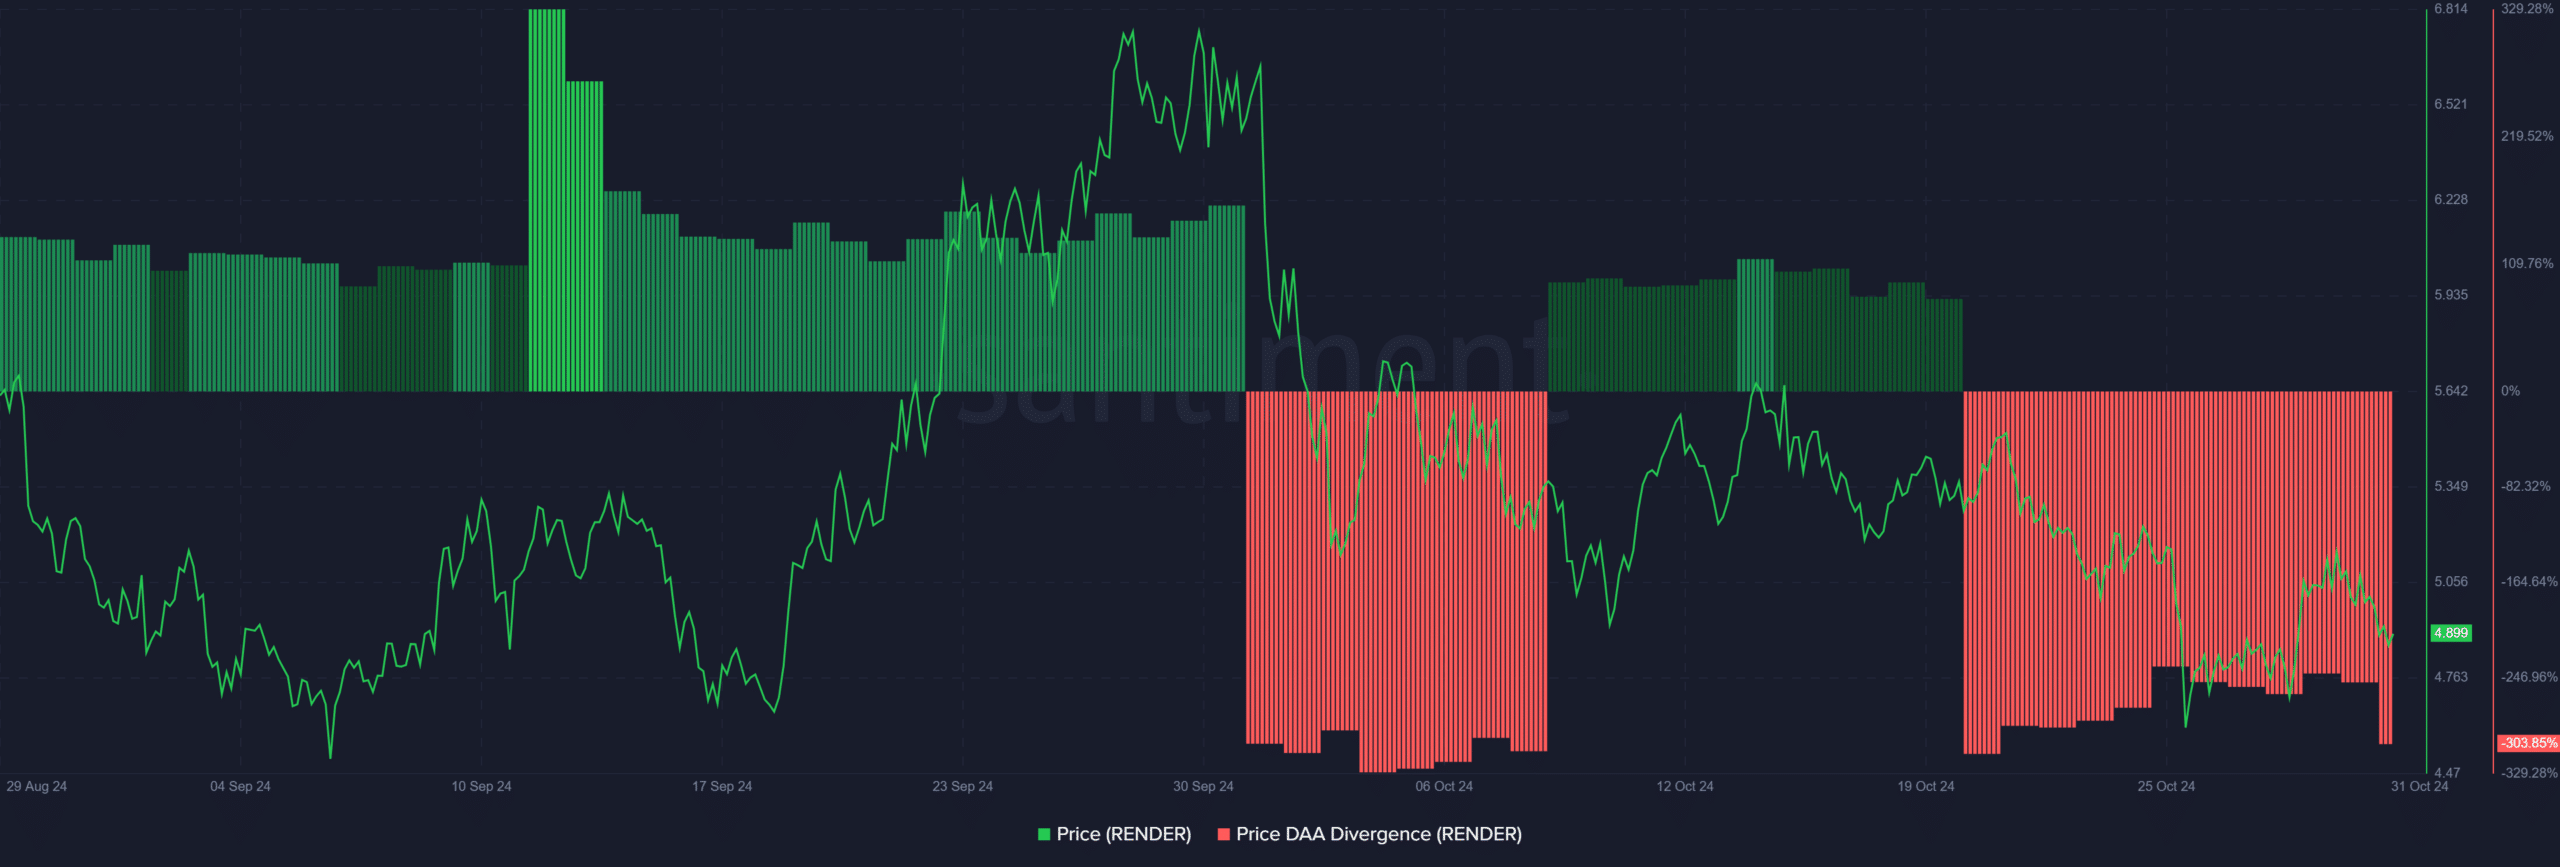
The DAA (Daily Active Addresses) divergence chart for RNDR highlights periods of significant negative divergence, with recent levels reaching as low as -303.85%.
This divergence indicates a mismatch between price and active addresses, implying that recent price attempts lack a corresponding increase in network activity.
However, if Render experiences a surge in active addresses, this divergence could reverse, lending crucial support to the price. Therefore, a shift in network activity could play a pivotal role in reinforcing RNDR’s price stability.
Onchain signals: What do the metrics reveal?
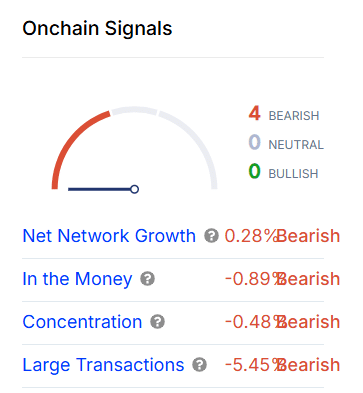
Render’s onchain indicators offer a cautious outlook. Net Network Growth, “In the Money” status, Concentration, and Large Transactions all present slight bearish readings.
For instance, Large Transactions show a -5.45% drop, suggesting that whale activity remains limited.
However, RNDR’s substantial daily volume could provide the liquidity necessary to absorb any selling pressure. Consequently, a change in onchain signals may shift sentiment and open doors for upward momentum.
Liquidation: A look at long and short positions
Render’s liquidation data reveals optimism among traders, with long positions reaching $49.97K compared to just $5.95 in shorts. This skew toward longs reflects a growing sentiment that a reversal might be imminent.
Additionally, with the trading volume remaining high, traders may be positioning for a breakout. Therefore, this bullish long-short ratio signals that market participants anticipate upward pressure, provided Render can clear resistance levels.
Read Render’s [RNDR] Price Prediction 2024–2025
Conclusively, Render’s technical and onchain data present a nuanced yet promising outlook. With strong market positioning and substantial trading volume, RNDR could indeed be primed for a reversal, provided it breaches key resistance levels and network activity strengthens.
Therefore, the stage appears set for RNDR to potentially break out of its downtrend and lead DePIN’s next growth wave.


