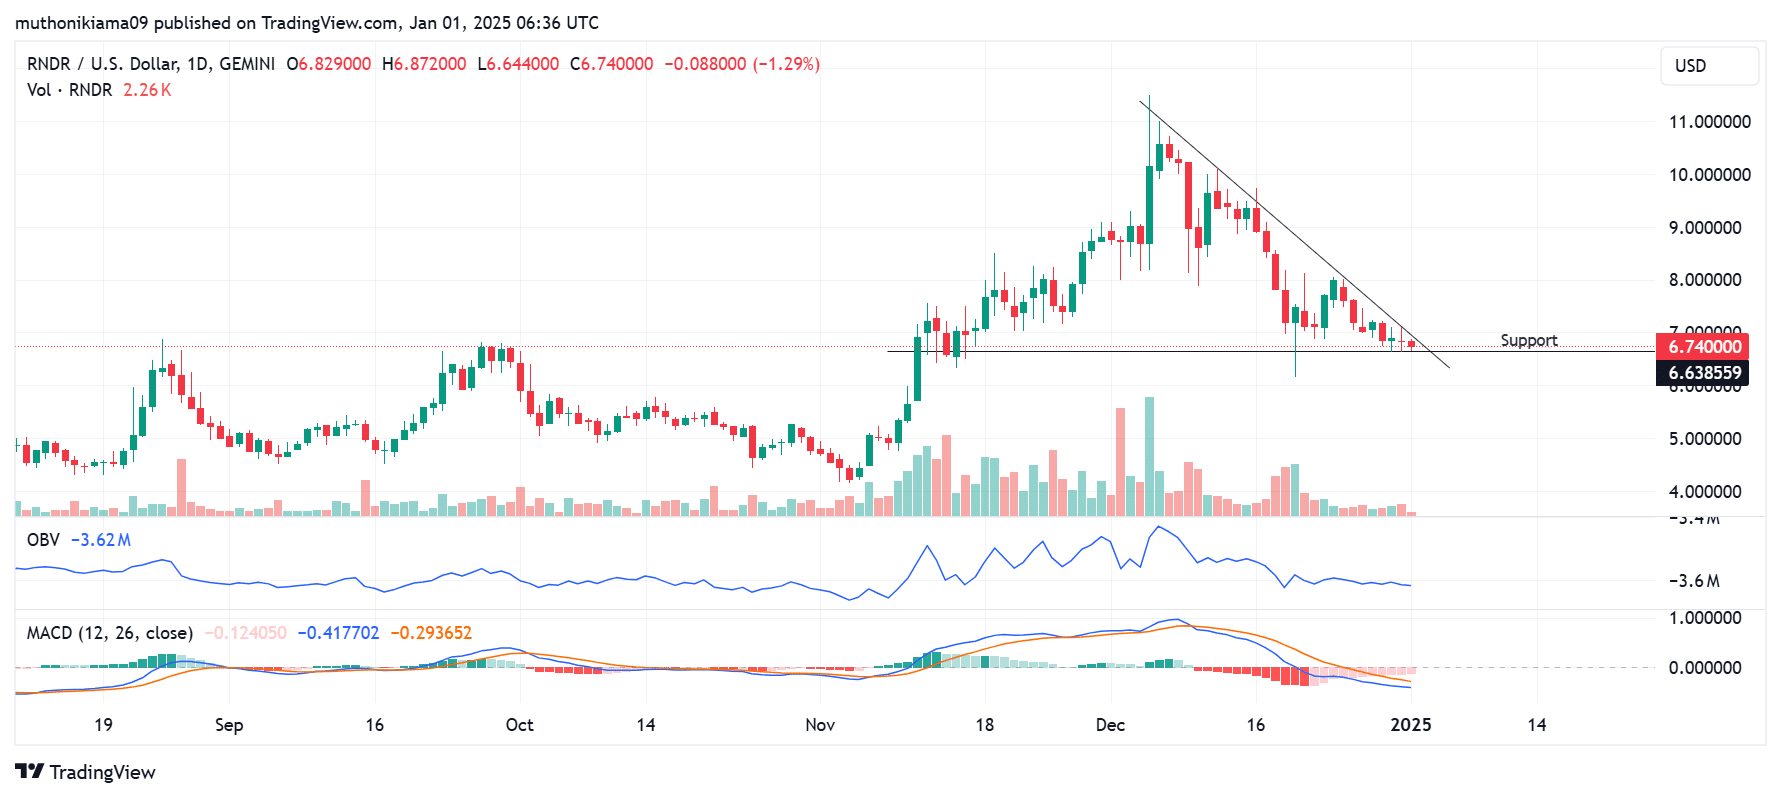
- Render was trading within a descending triangle pattern on its one-day chart, indicating it was in a clear downtrend.
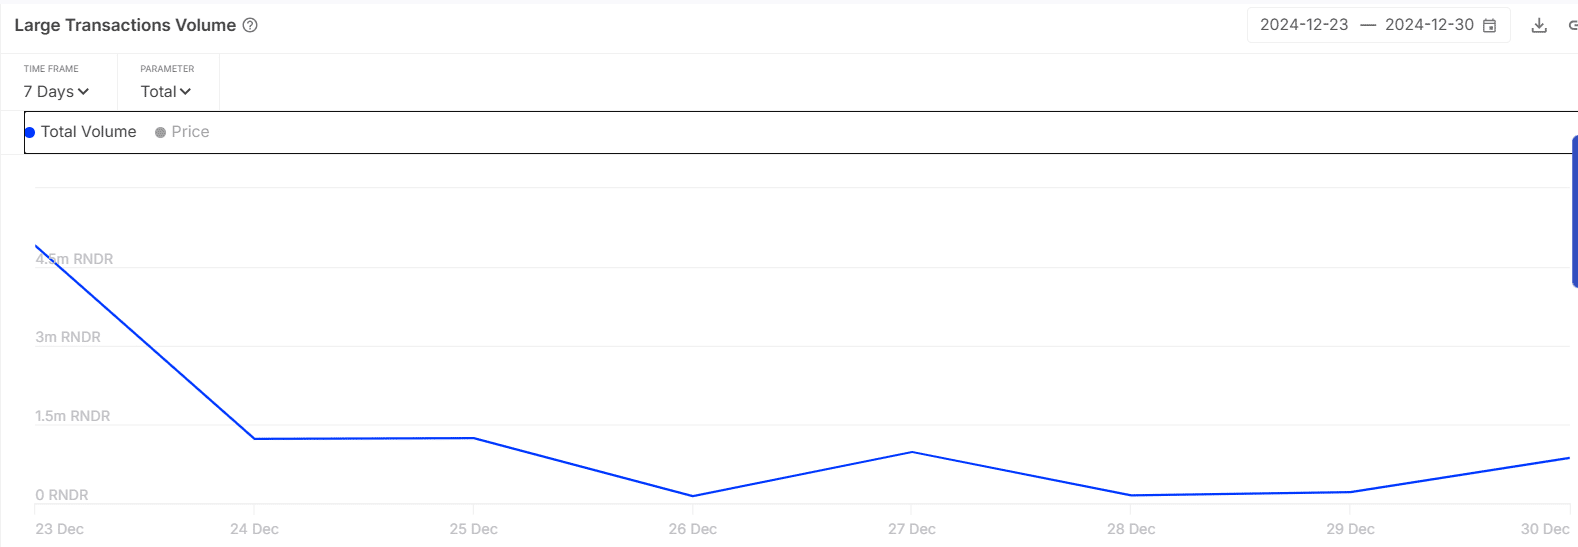
- Whale activity also increased, with transactions exceeding $100,000 increasing from 148,460 to 866,180 tokens.
Render [RNDR] was trading at $6.73, at press time, after a slight 0.58% drop in 24 hours. Trading volumes had also dropped by 24% per CoinMarketCap, indicating a decline in market participation.
While Render gained by 51% in 2024, the long-term outlook shows bearish trends that could weigh on RNDR’s price in 2025.
Render’s descending triangle pattern
Render was trading within a descending triangle pattern on its one-day chart, indicating a clear downtrend.
Additionally, the On-Balance-Volume (OBV) indicator was dropping, confirming that the downtrend was due to selling activity. If buyers remain hesitant, it will hinder the potential for recovery.
The Moving Average Convergence Divergence (MACD) line indicated bearish momentum as it oscillated below the signal line. However, the histogram bars suggest that the bearish strength is weakening, which could lead to price consolidation.
Key levels to watch include support at $6.60. If Render drops below this level, it could trigger further declines. Conversely, $7 is acting as strong resistance, and a break above this level could signal a bullish reversal.
Whale activity spikes
Amid the prevailing bearish trends, Render whales are becoming active once again. According to IntoTheBlock data, transactions exceeding $100,000 have significantly increased in the last two days, rising from 148,460 RNDR to 866,180 RNDR.
While this increase does not confirm that these whales are buying, it could result in a surge in price volatility. This is because whales account for 76% of the total RNDR supply.
Despite the recent increase, whale activity also remains at range lows compared to the weekly high. A sharp increase caused by either buying or selling activity could precede significant price changes.
Falling network activity could fuel a downtrend
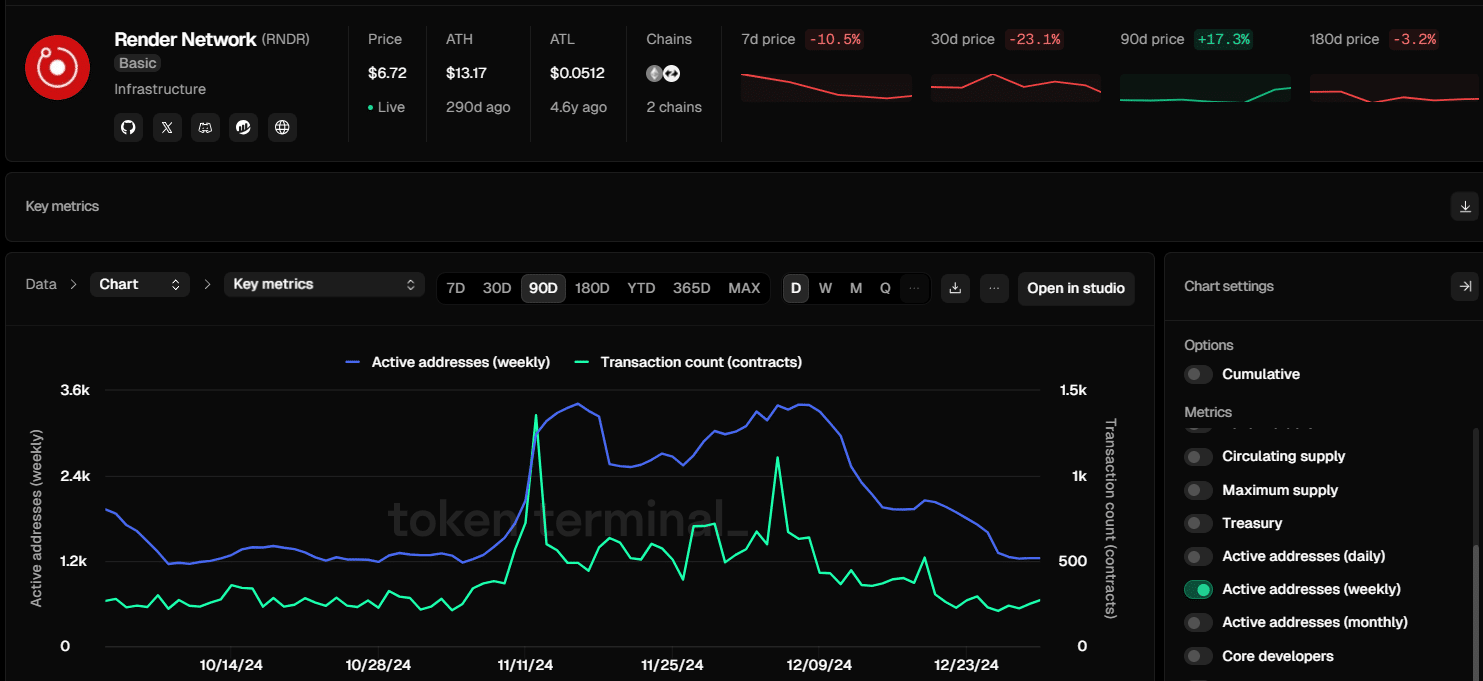
Data from TokenTerminal shows a significant decline in activity on the Render network. The number of active weekly addresses on the network is approaching a two-month low after dropping by 50% in December 2024.
On the other hand, the total transaction count has also declined to 270, confirming that fewer people are using the network.
If the Render network fails to attract new users, it could impact the ability of the RNDR token to recover from bearish trends.
Can Render recover from bearish trends in 2025?
Render’s recovery from bearish trends in 2025 will likely be influenced by two factors: buying activity and network activity. If buyers become active again and absorb the sell-side pressure, it could bode well for RNDR.
Read Render’s [RNDR] Price Prediction 2024–2025
If the Render network records a spike in usage, it could also drive buyer interest and increase market participation.


![Will Ethena [ENA] start 2025 with a 50% drop to $4.5? Assessing…](https://hamsterkombert.com/wp-content/uploads/2025/01/Will-Ethena-ENA-start-2025-with-a-50-drop-to.webp-150x150.webp)