- Notcoin’s falling wedge breakout pattern and strong RSI and MACD indicators suggest bullish momentum.
- Mixed on-chain signals and high short interest hint at potential for a short squeeze.
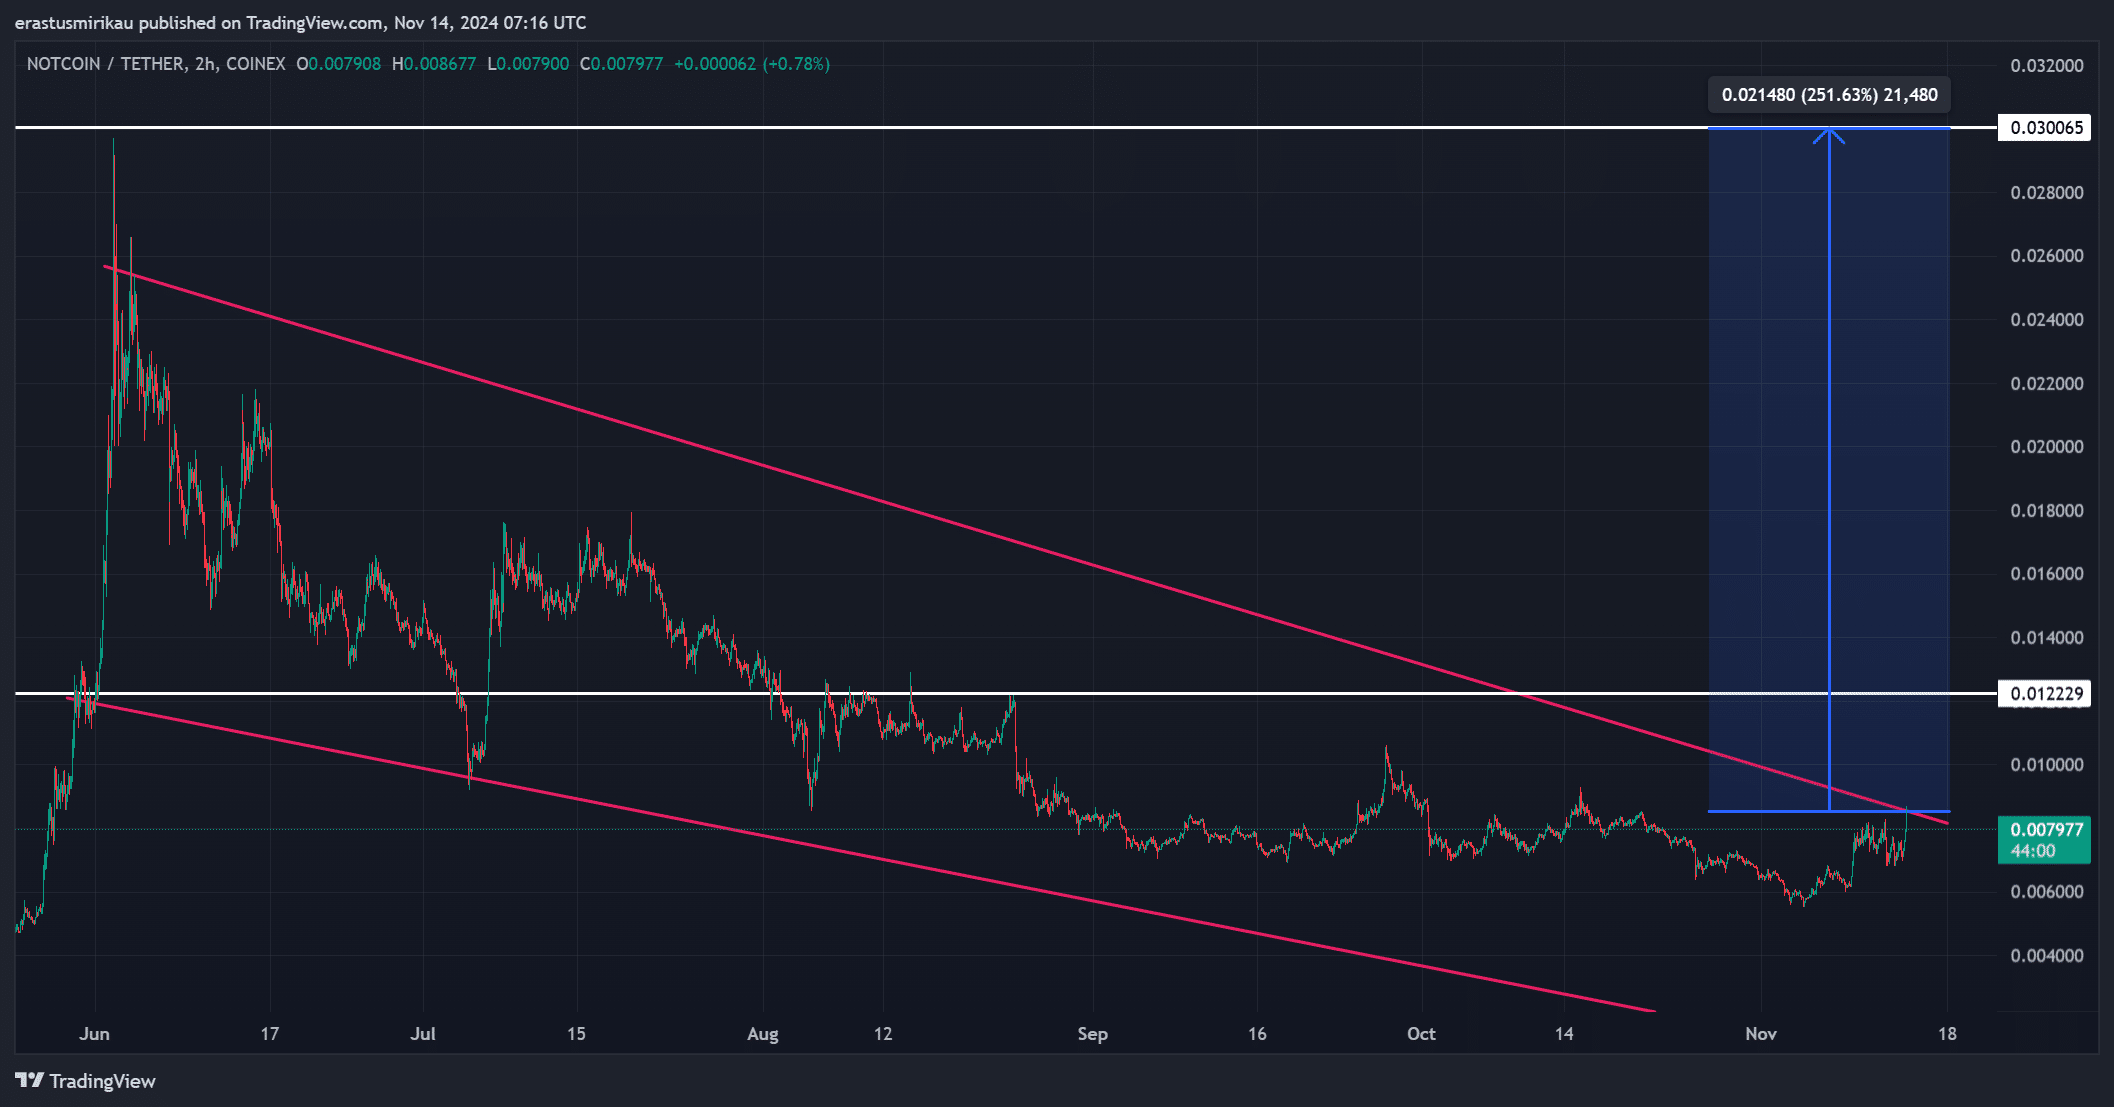
Notcoin [NOT] appears poised for a breakout from a falling wedge pattern, with the token surging by 12.89% over the past 24 hours to reach $0.008007 at press time. This pattern typically signals a bullish reversal, fueling speculation of further gains ahead.
A successful breakout could propel the price towards the initial resistance level of $0.01222, with an extended target set at $0.030. This ambitious target represents a potential 251% upside, sparking interest in whether NOT can capitalize on this bullish setup.
NOT approaching a crucial breakout level
The falling wedge pattern on NOT’s chart is encouraging for bulls, as this formation often leads to a trend reversal. Currently, NOT is edging close to a breakout, which could see it testing the immediate resistance level at $0.01222.
Therefore, this price point becomes a critical threshold; clearing it would not only confirm a breakout but could also push NOT toward its long-term target of $0.030.
Breaking above $0.01222 could attract increased buying interest, propelling the price even further as momentum builds.
Bullish signals from RSI and MACD
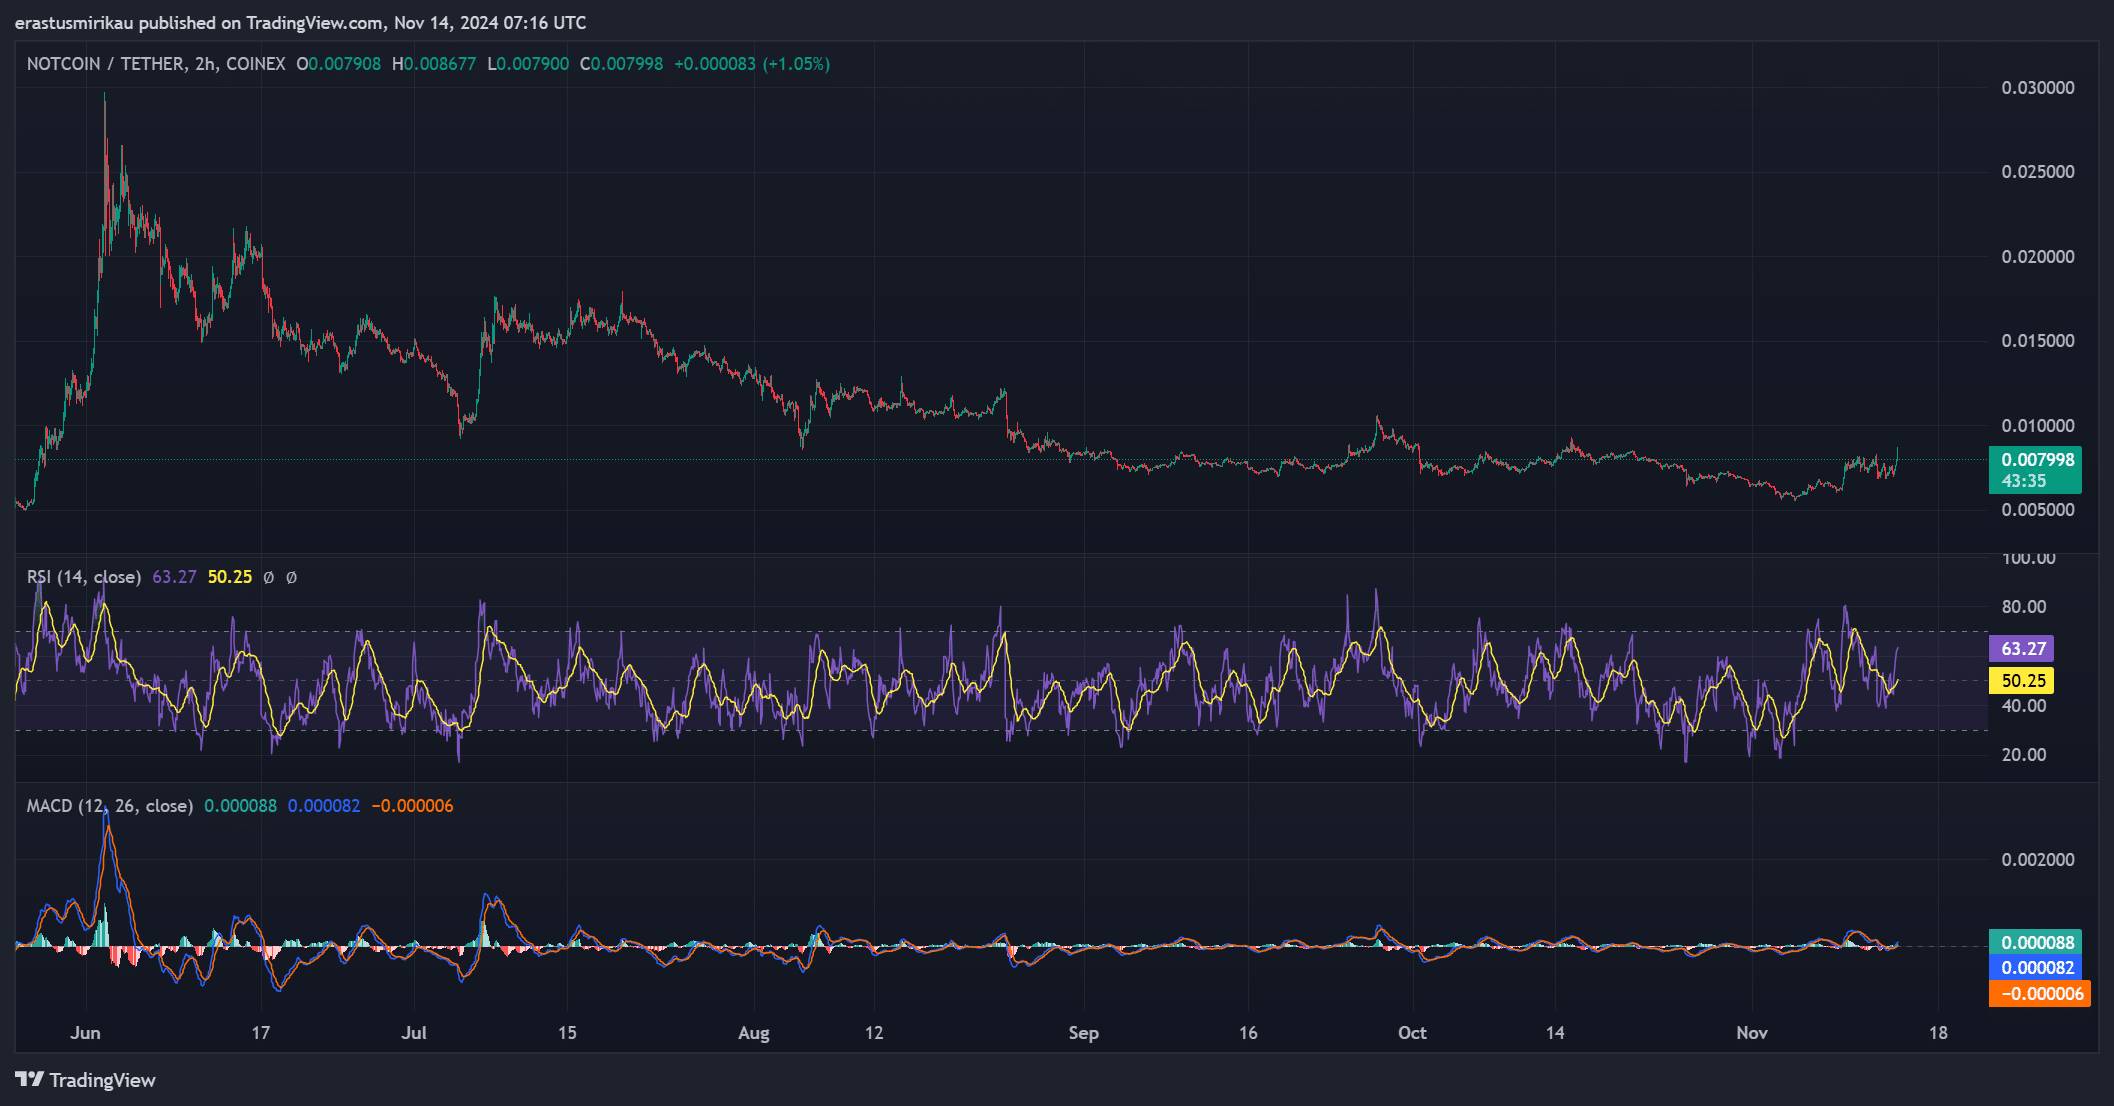
Technical indicators reinforce the bullish narrative for NOT. The Relative Strength Index (RSI) currently reads 63.27, indicating positive momentum without entering overbought territory.
Consequently, there’s room for more upward movement before the price faces potential pullback pressure.
Additionally, the Moving Average Convergence Divergence (MACD) has shown a bullish crossover, where the MACD line has overtaken the signal line. This crossover is a strong indication of growing buying interest, supporting the breakout scenario.
NOT on-chain activity shows mixed sentiment
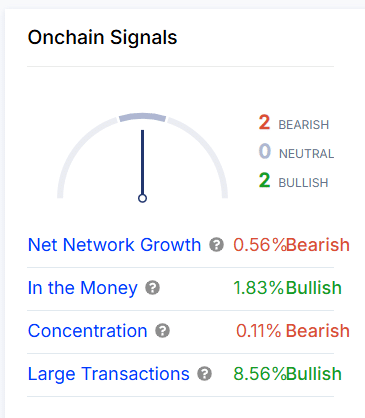
Examining on-chain data, there are both bullish and bearish indicators for NOT. Net network growth has slightly decreased by 0.56%, a bearish sign that suggests limited new user inflow.
However, other metrics are positive, with the “In the Money” metric up by 1.83%, indicating that more holders are in profit, which could drive confidence among investors.
Additionally, large transactions have surged by 8.56%, reflecting heightened activity from institutional or high-value traders. Despite a slight dip in concentration (down by 0.11%), these mixed signals generally lean towards a positive outlook.
Liquidation data hints at possible short squeeze
Analyzing liquidation data, we see a tilt towards short positions, with $352.91K in shorts compared to $268.52K in longs. This indicates some market skepticism, as a larger volume of traders are betting against a NOT rally.
However, this setup could also lead to a short squeeze if
Notcoin successfully breaks out, forcing short positions to close and pushing the price upward. Binance leads in long liquidations at $149.61K, indicating strong buying interest, while short positions remain prominent across major exchanges, signaling potential for rapid price action.
Read Notcoin’s [NOT] Price Prediction 2024–2025
With a favorable chart setup, supportive technical indicators, and mixed but mostly optimistic on-chain signals, Notcoin appears primed for a breakout. Clearing the $0.01222 resistance could trigger a rally, with a realistic path toward the $0.030 target.
Given the current momentum and potential for a short squeeze, NOT has a strong chance of achieving its ambitious upside.


