- Analysts have drawn striking parallels between LTC and XRP, fueling speculation of a potential breakout.
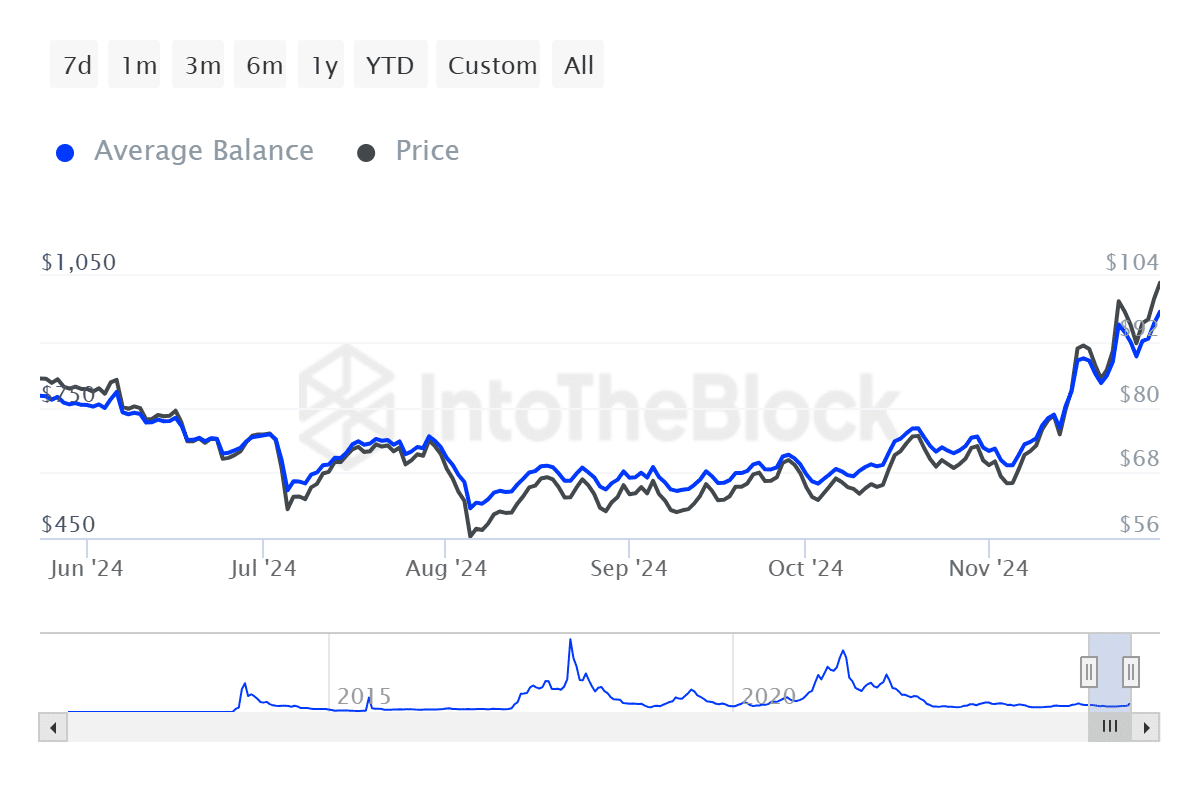
- Investor activity also supports this outlook, with the average balance of LTC-holding addresses showing a notable increase.
Over the past 24 hours, Litecoin [LTC] has surged by 18.31%, driven by heightened investor interest and market momentum.
This spike coincides with a sharp 305.15% rise in trading volume, underpinned by increased transaction activity.
Insights from AMBCrypto suggested LTC’s price behavior may mirror XRP’s, setting the stage for a major upswing. Also, this potential surge could occur independently of a broader altseason.
THIS points to potential LTC breakout
Analyst Moonshilla has highlighted a fractal pattern in LTC’s price action that mirrors XRP’s behavior when it traded between $0.40 and $0.60.
If this pattern fully materializes, LTC could experience a rally of 3.5x or more, potentially revisiting price levels last seen during the May 2021 bull market.
Moonshilla commented:
“LTC [is] about to print a god [candle] like XRP.”
This reference alludes to the massive bullish surge that propelled XRP to new highs, as observed on its three-month chart timeframe.
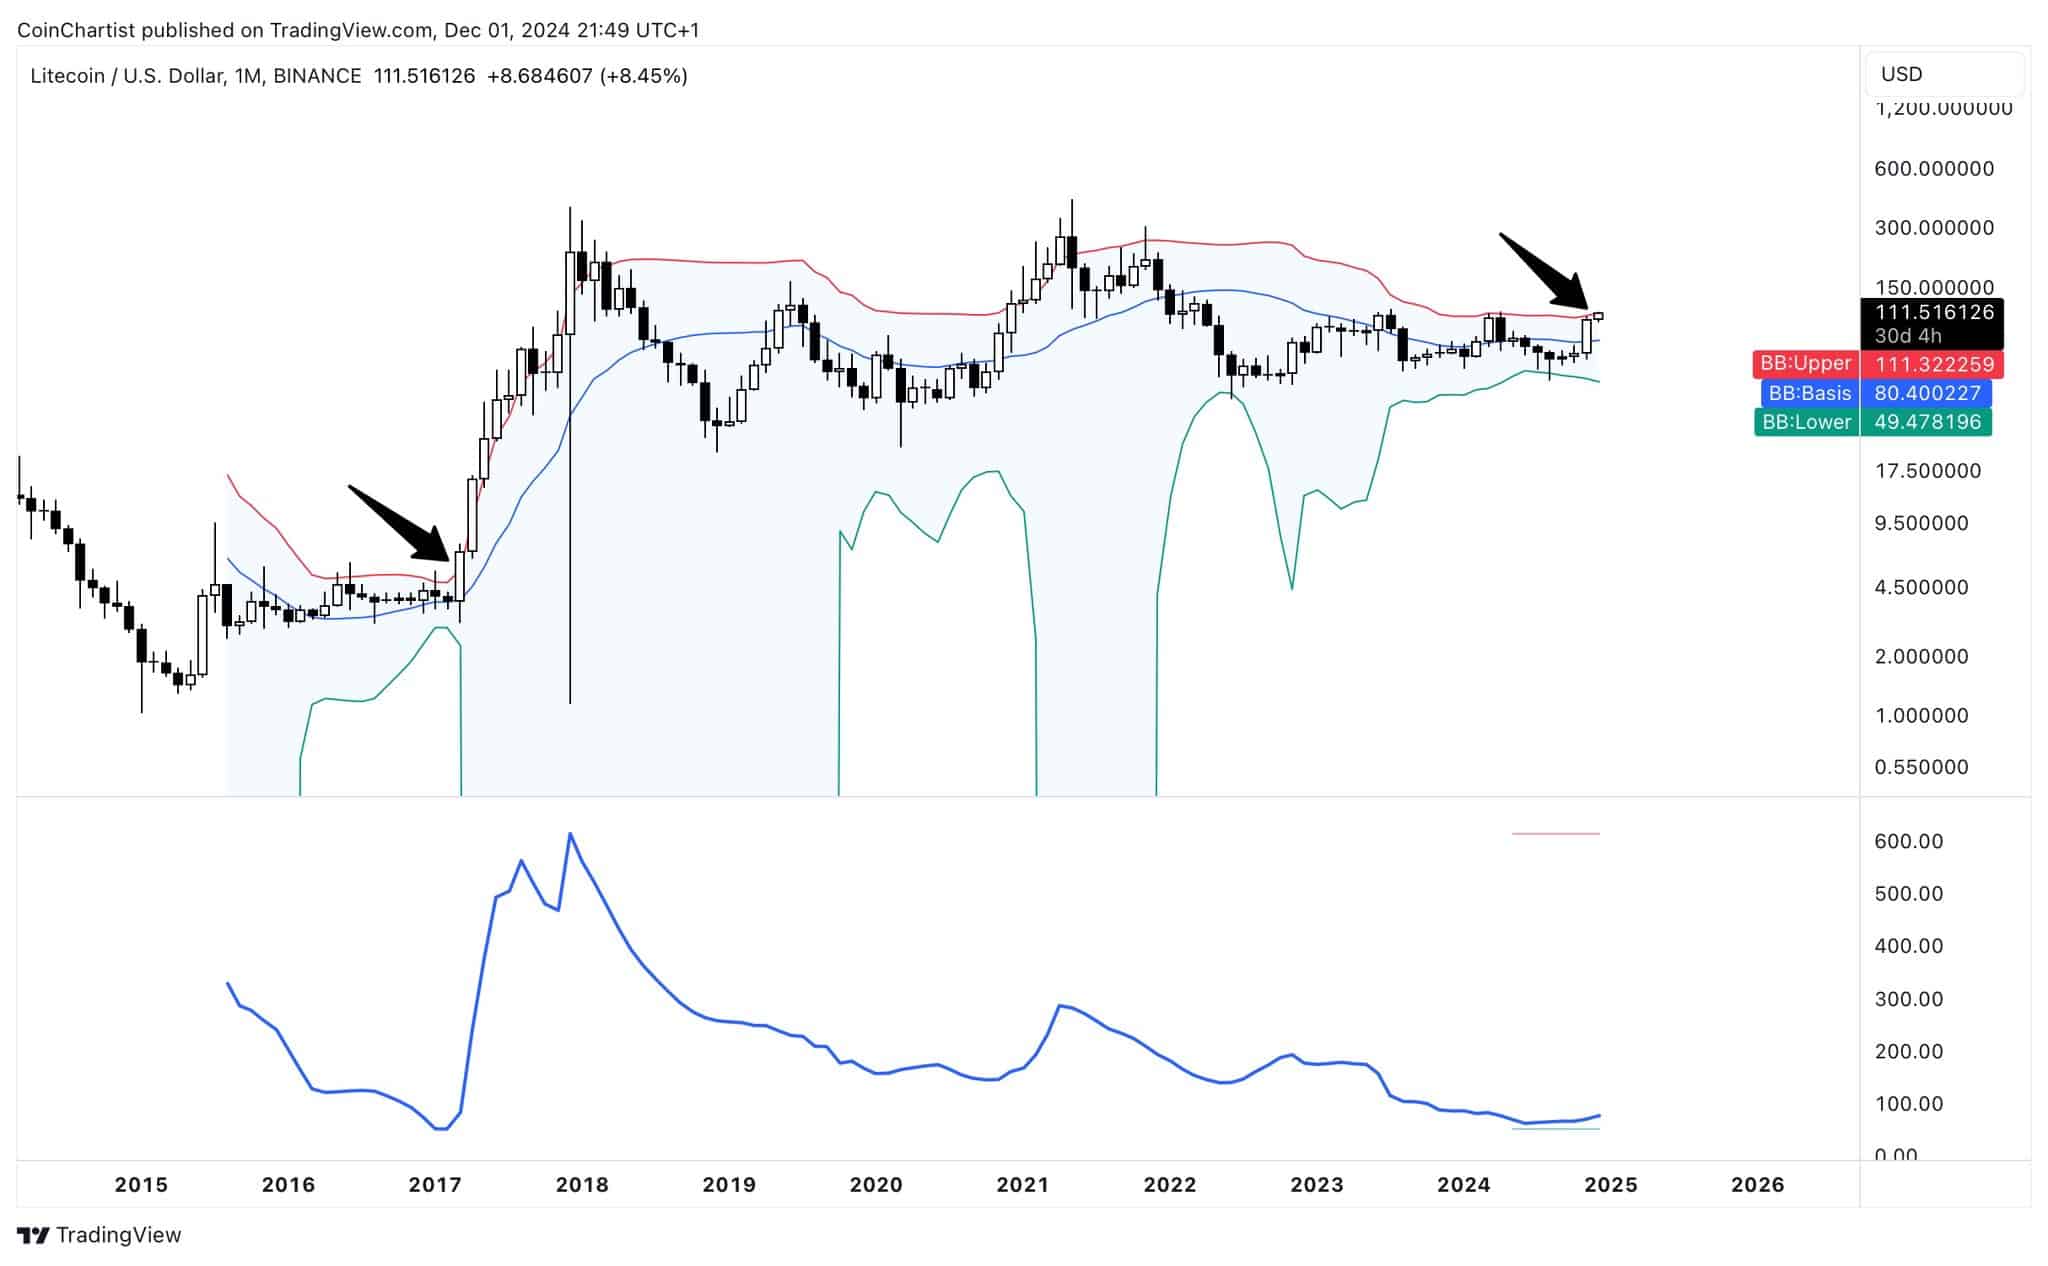
Similarly, analyst Tony—who accurately predicted XRP’s major price breakout based on Bollinger Band metrics when XRP was trading at $0.726—has identified a comparable setup for LTC.
Tony’s analysis shows LTC trading near the red outer band of the Bollinger Bands on its monthly chart, with the Bollinger Band Width displaying a structure akin to XRP’s pre-rally movement.
The subtle uptick in the bandwidth indicates growing volatility, which often precedes upward price action.
For context, Bollinger Bands consist of a central moving average and two outer bands that expand or contract based on price volatility.
The Bollinger Band Width, which measures the gap between the bands, is a reliable indicator of market volatility.
Historically, a price breakout above the upper band, combined with an increase in the Bollinger Band Width, has often triggered notable rallies.
If LTC follows this pattern, it could be ready for a substantial breakout in the near term.
LTC gearing up for a potential rally
Insights from IntoTheBlock and Coinglass indicated increasing buying activity among both spot and derivative traders, which means growing interest in LTC.
The Average Balance, which measures the mean amount of LTC held across addresses, has risen steadily. At the time of writing, it has reached a seven-day high of $968.16.
This increase suggests that more wallets are accumulating LTC, a bullish signal that often precedes upward price movements.
Derivative data further supports this outlook. According to Coinglass, there has been a significant short liquidation of $5.51 million—a situation that occurs when the market moves against bearish positions.
Read Litecoin’s [LTC] Price Prediction 2024–2025
Such liquidations often amplify bullish momentum as traders reposition.
If these trends persist alongside rising trading volume and continued accumulation, LTC could see further price gains.


