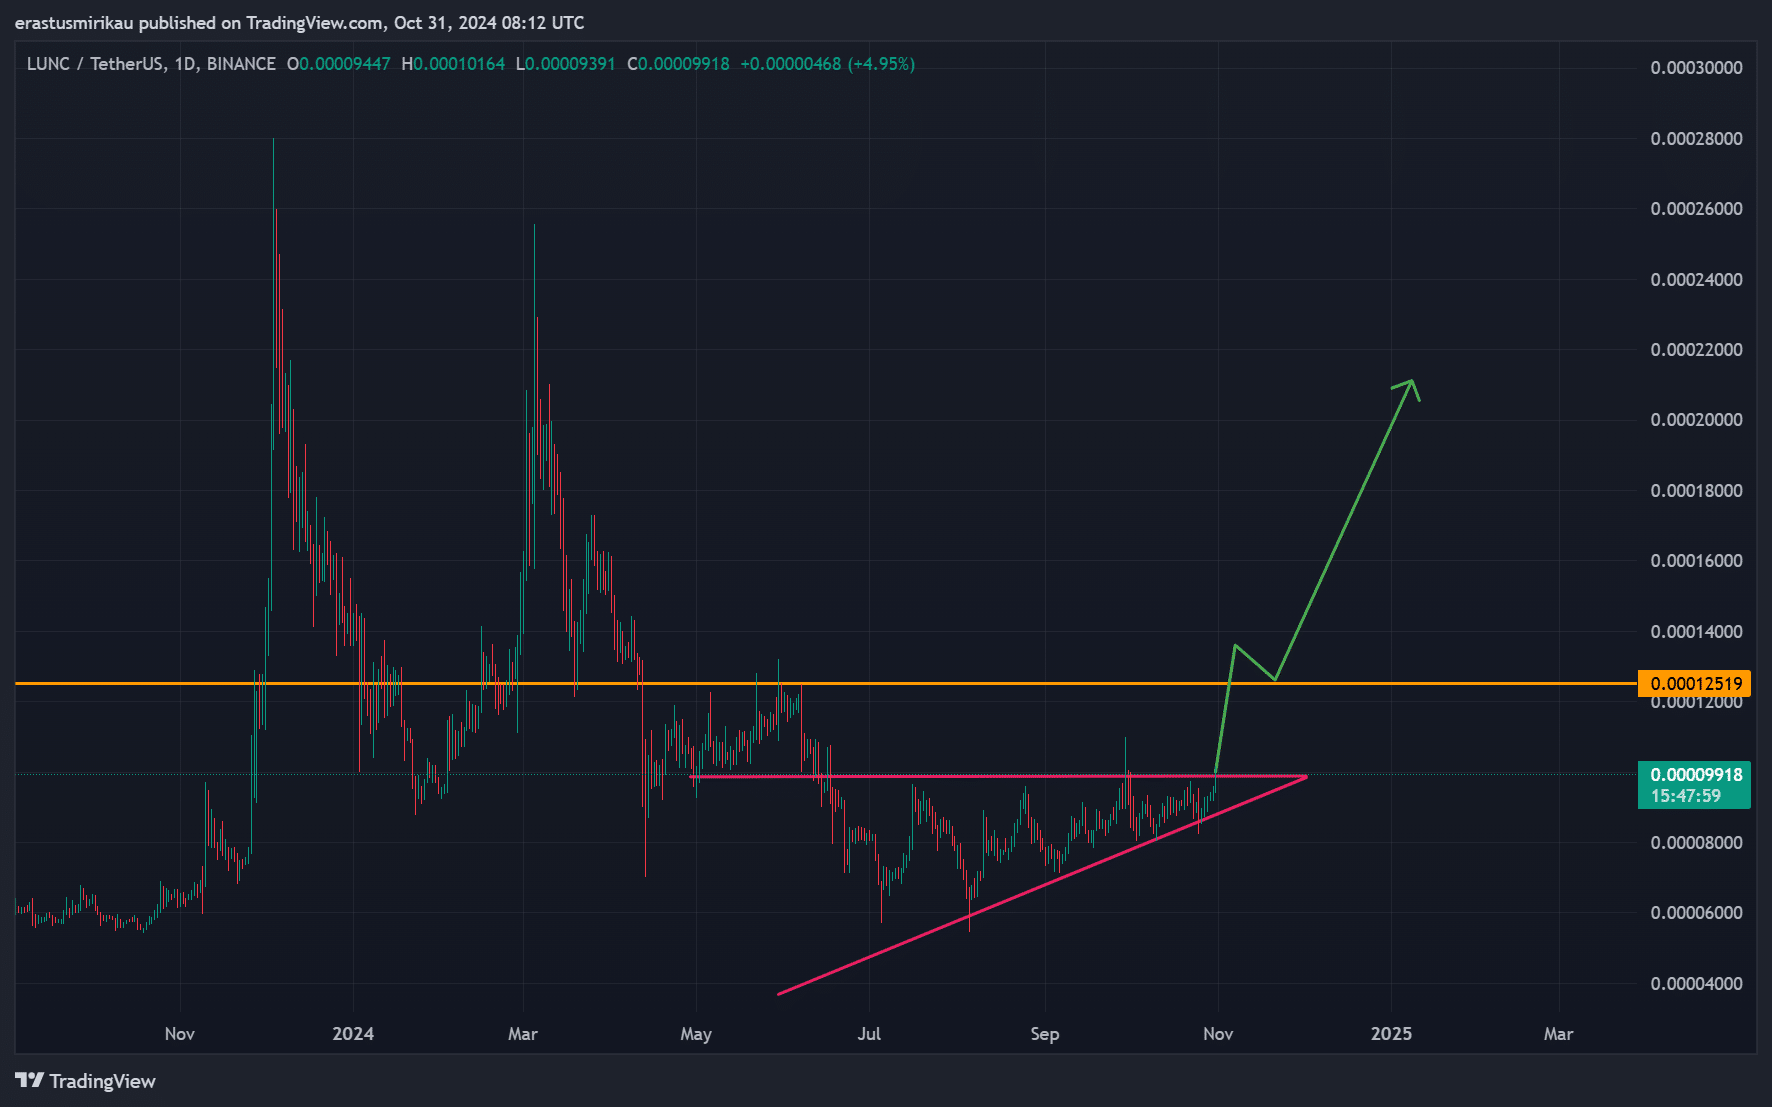
- LUNC’s ascending triangle pattern and technical indicators suggest a possible bullish rally if it breaks resistance at $0.00012519.
- High volume surge and short interest imbalance could drive a strong price movement post-burn.
Terra Classic [LUNC] has triggered excitement across the crypto community with a bullish breakout from an ascending triangle pattern, positioning itself for a potential rally.
With the highly anticipated burn of 270 billion LUNC tokens scheduled for October 31st, the market is buzzing with speculation.
Trading at $0.00009937 and up 5.15% at press time, LUNC faces key resistance that could determine its next move. But can it keep this momentum?
Ascending triangle pattern signals bullish potential
The ascending triangle pattern formed by LUNC suggests growing bullish interest, as each attempt at the upper resistance shows buyers willing to push prices higher.
This structure, often a sign of strong uptrend potential, implies LUNC could see significant gains if it breaks above the resistance level at $0.00012519.
Consequently, traders are watching this key price level, as a confirmed breakout could trigger a wave of buying. However, failure to hold this pattern may lead to sideways movement or even a pullback, dampening recent optimism.
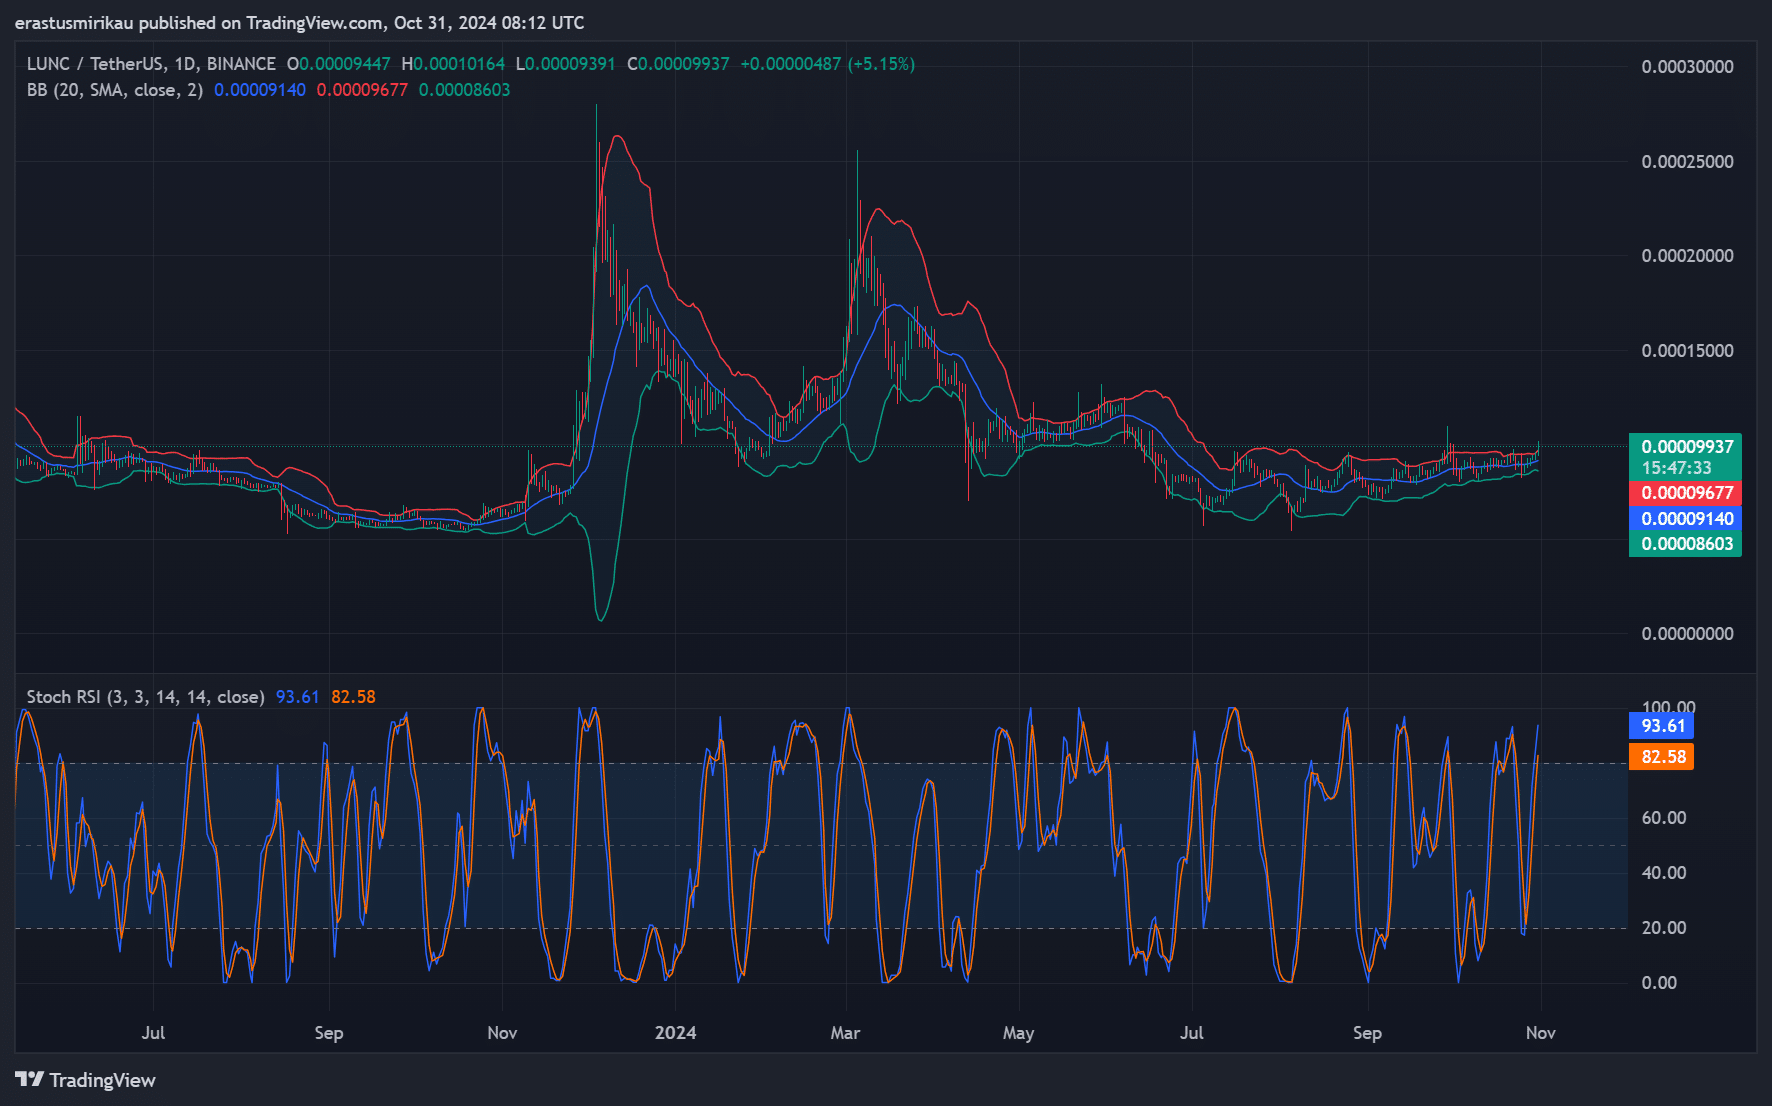
What do the Bollinger Bands and STOCH RSI reveal?
Examining technical indicators offers more clues about LUNC’s position. The Bollinger Bands (BB) are tightening, indicating reduced volatility but also signaling a possible breakout on the horizon.
Therefore, if LUNC breaks above the resistance, the widened bands could support a strong move upward. Additionally, the Stochastic RSI reveals an overbought condition, with values reaching 93.61 and 82.58. This suggests potential profit-taking by some traders in the near term.
However, as long as the price stays above crucial support levels, the upward trend may persist, giving LUNC a solid foundation for further gains.
Volume surges over 200%: A sign of interest?
LUNC’s trading volume has surged by an astonishing 222.09%, reaching $34.02 million. This spike indicates increased interest from investors, a critical factor in sustaining price moves.
High trading volume often confirms the strength of breakouts, and with LUNC’s volume rising sharply, it suggests that market participants are anticipating a rally post-burn.
Therefore, this volume increase acts as a reinforcement of bullish sentiment, signaling that the recent breakout may have solid backing.
Are shorts overpowering longs?
The long/short ratio provides valuable insight into market sentiment. Currently, 55.57% of trades are short positions, with only 44.43% long.
This imbalance could create a short squeeze if LUNC’s price rises, forcing short sellers to cover their positions and pushing the price even higher.
However, the majority short position may also indicate a cautious outlook among traders, suggesting LUNC could face resistance at higher levels. Consequently, the long/short dynamic will be a key factor in determining whether LUNC can sustain its rally.
Is your portfolio green? Check the LUNC Profit Calculator
Will LUNC continue its upward journey?
With strong volume, a bullish chart pattern, and the upcoming burn event, LUNC appears poised for a potential rally. However, overbought technicals and a significant short interest raise questions about the sustainability of this upward movement.
If LUNC clears its key resistance at $0.00012519, it could lead the next leg of the altcoin market rally. But without a decisive breakout, this momentum might lose steam.


