- Grass crypto blasted past $3 on high trading volume.
- Further gains might take a day or two to unfold, price dip anticipated.
Grass [GRASS] crypto has established a new high and continues its price discovery phase. The daily trading volume has increased by 21.6% in the past 24 hours, standing at an impressive figure of $601 million.
Technical analysis showed that the token could see a pullback and fall below the $3 mark. Such a dip would likely be a buying opportunity since the market structure is bearish. A retracement below $2.5 could be the first sign of an extended correction.
Bearish divergence hints at overextended market
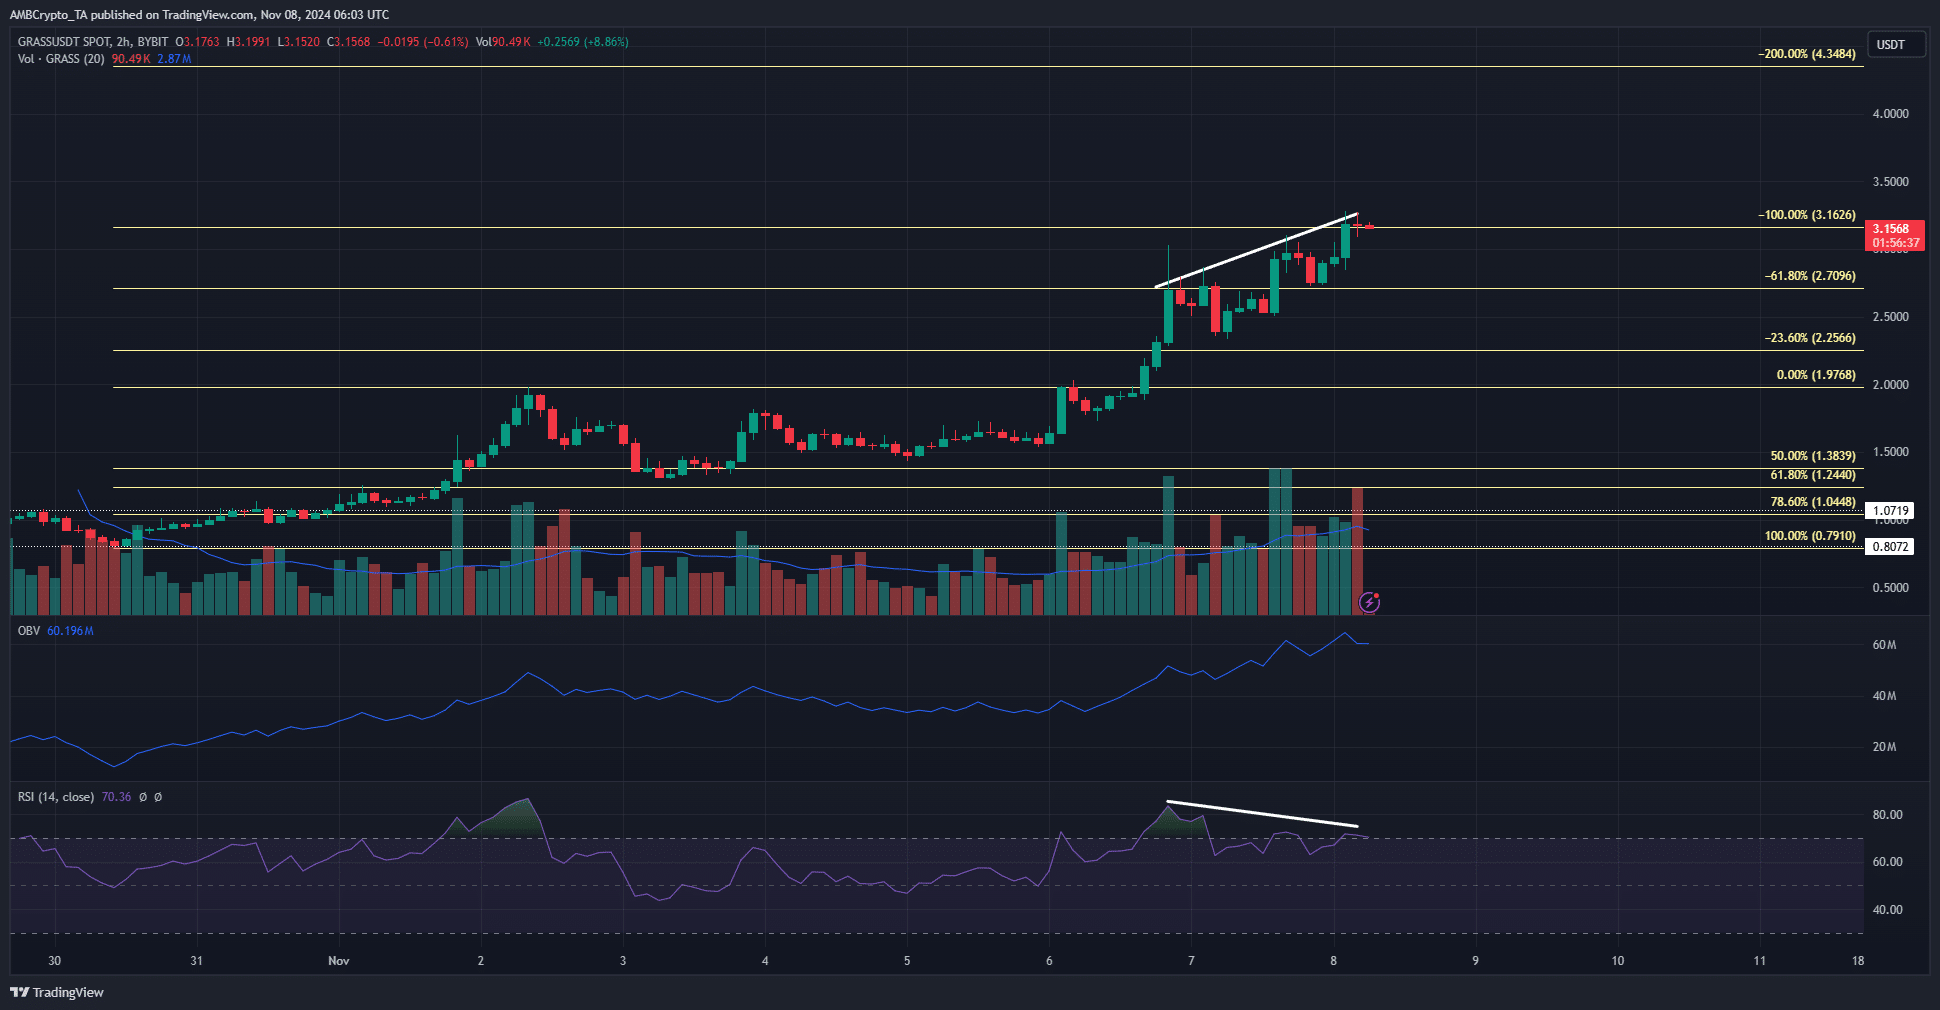
Since the 5th of November, the trading volume has been trending higher. The OBV was also climbing steadily, showing that buying pressure was high and the GRASS gains were driven by genuine demand.
The RSI on the 4-hour chart has been above neutral 50 for the past three days. It showed that momentum was strongly bullish, but formed a bearish divergence over the past two days.
The RSI formed lower highs while the price pushed higher to form higher highs. This divergence does not guarantee a trend reversal. Instead, it is a sign that the market is more likely to see a minor pullback.
The $2.7-$2.85 former resistance zone is expected to serve as support in the coming days in the event of a pullback.
Potential 14% pullback for Grass crypto


Source: Coinglass
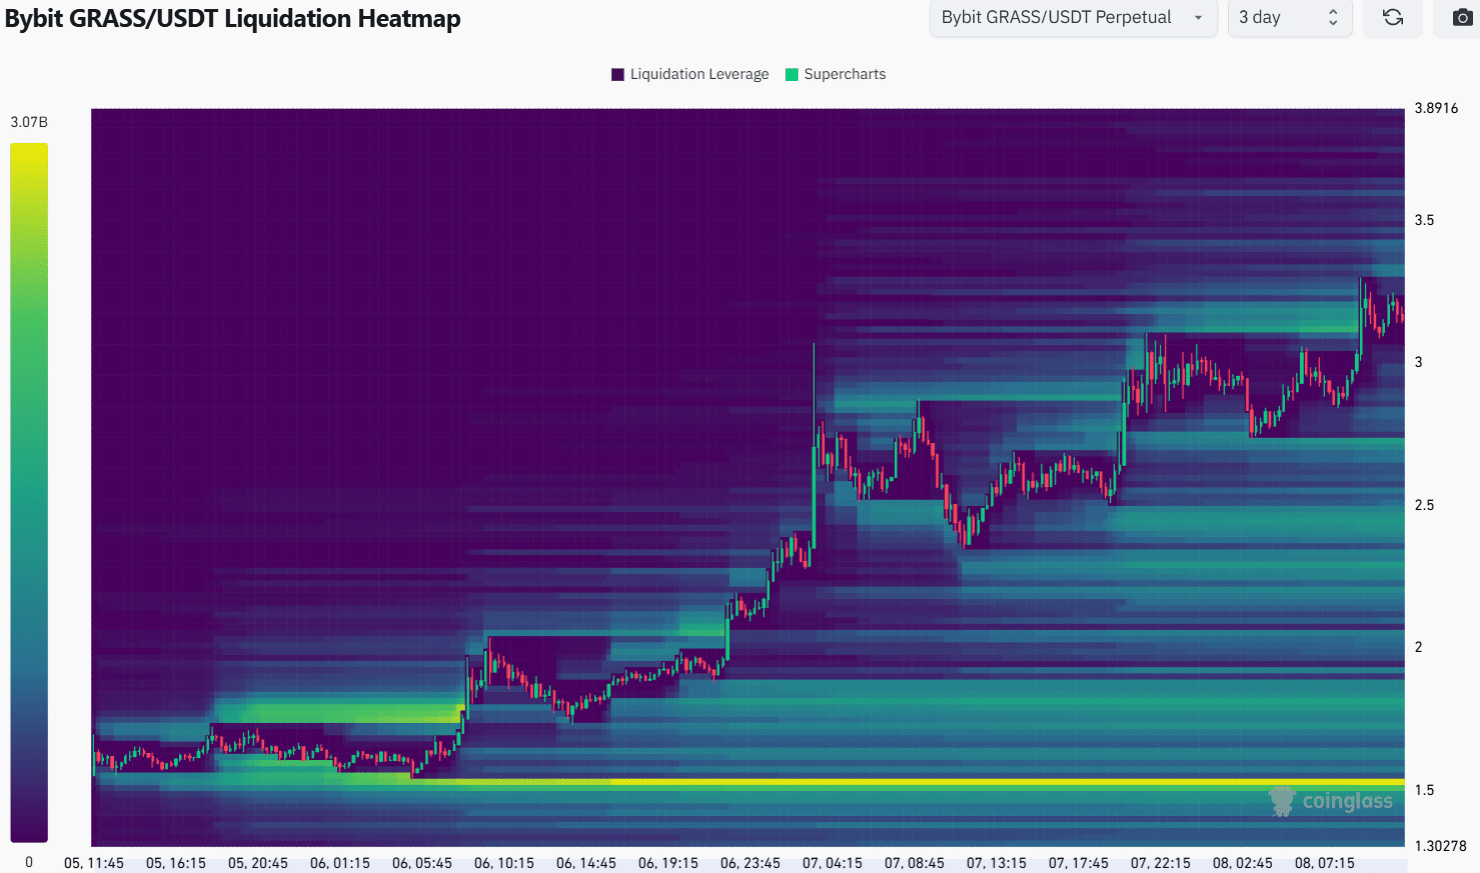
Another indication that the $2.7 area is a demand zone came from the short-term liquidation heatmap. The previous high at $3.03 saw an appreciable amount of liquidity gather just above it over the past 24 hours.
Is your portfolio green? Check the Grass Profit Calculator
Consequently, GRASS price was magnetized toward it and has swept this zone. It is possible that the token goes on to register more gains.
However, due to the momentum divergence on the H4 chart, a pullback to the nearest liquidity pool at $2.7 is also possible.
Disclaimer: The information presented does not constitute financial, investment, trading, or other types of advice and is solely the writer’s opinion


