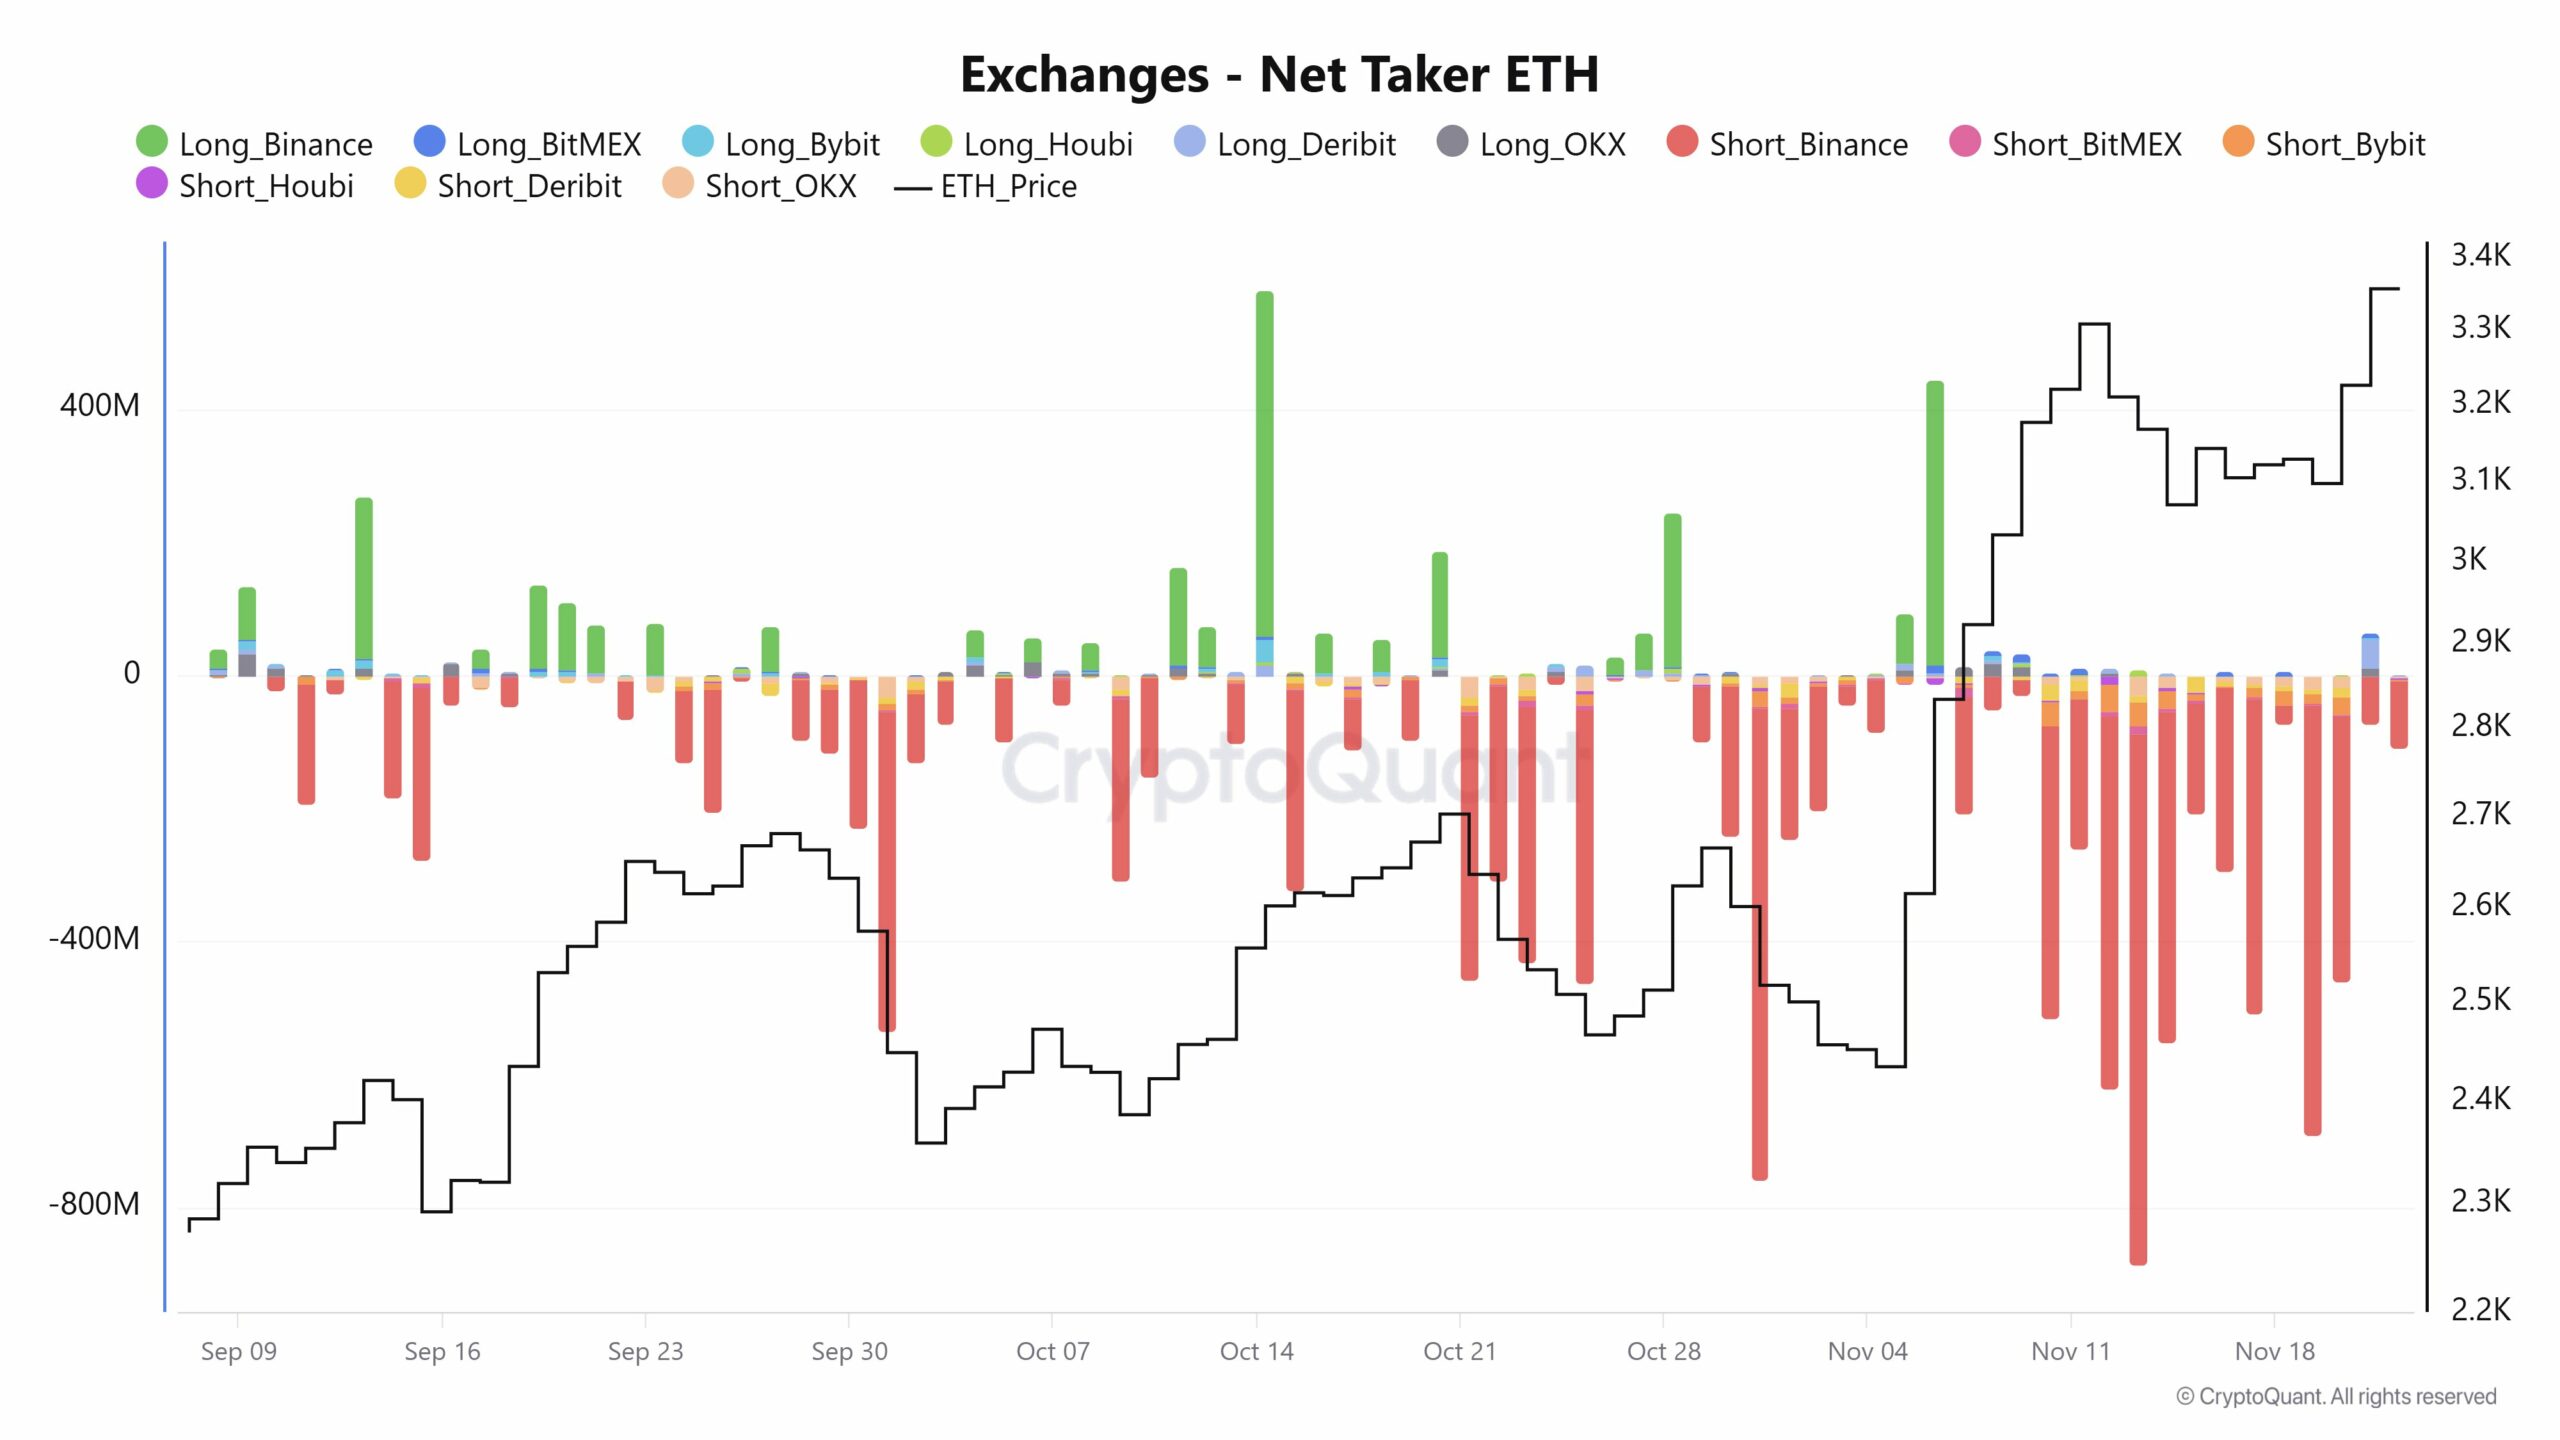
- There is a vast difference in the net taker volume in exchanges of Bitcoin and Ethereum.
- Three factors could influence ETH to change to the right side.
The exchange activities between Bitcoin [BTC] and Ethereum [ETH] showed that they significantly influenced the market behavior.
For the uninitiated, the Taker Buy/Sell Ratio on CryptoQuant provides insight into market sentiment by showing the proportion of buy orders to sell orders, a critical indicator during market rallies or corrections.
At press time, both Bitcoin and Ethereum showed distinct patterns in net taker volume in exchanges.
Ethereum’s net taker showed that the asset was not moving similarly to BTC, which is pivotal in shaping the short-term and long-term outlooks for these cryptocurrencies.
If most negative money numbers turn to the positive side, ETH could see the big pump as more traders are taking buy positions. But when and how will this happen?
ETH derivatives signal bullish momentum
One influencing factor is the bullish momentum in the Ethereum derivatives market, indicated by Open Interest soaring past its previous ATH to exceed $13 billion.
This 40% increase over the last four months suggested engagement in Ethereum’s derivatives sector.
Moderately positive funding rates further highlighted that long-position traders dominated, further affirming bullishness in the short term.
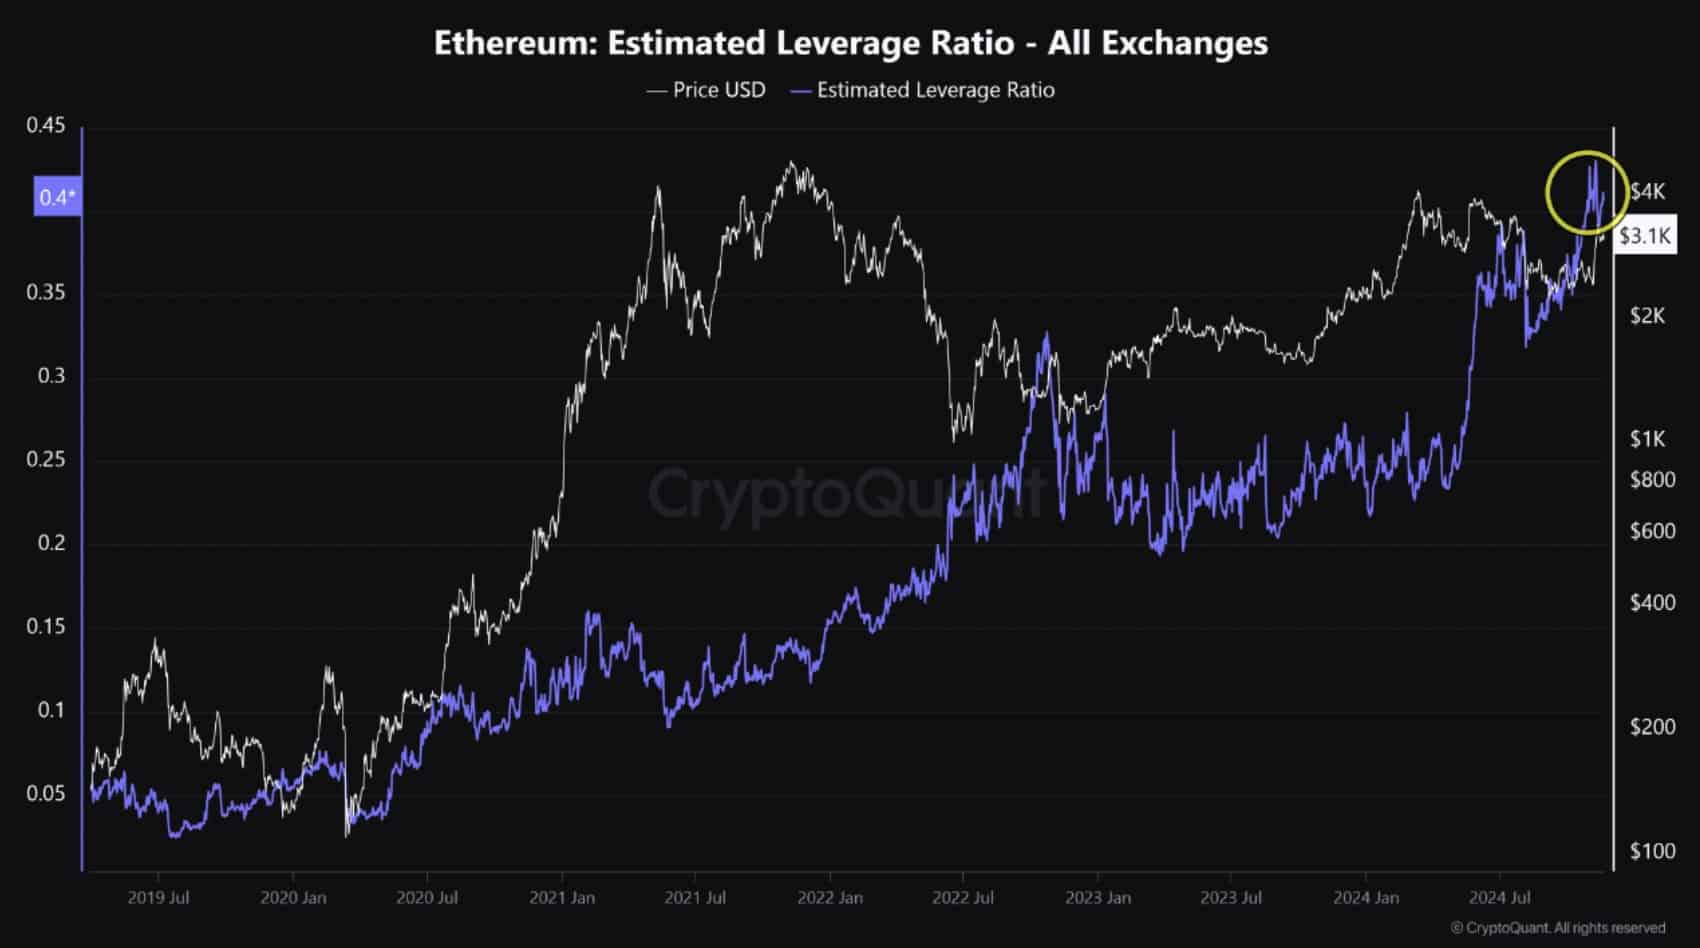
Moreover, Ethereum’s estimated leverage ratio has hit a new peak, reaching +0.40 for the first time.
This indicator of rising leveraged positions reflected a higher inclination for risk-taking among investors.
Despite the optimism, the prevailing high leverage and dominance of long positions could heighten the potential for a long squeeze.
Such a market correction might occur if abrupt price volatility prompts these traders to liquidate positions swiftly, reminding them of the inherent risks associated with highly leveraged trading.
High-leverage liquidations and altcoin season
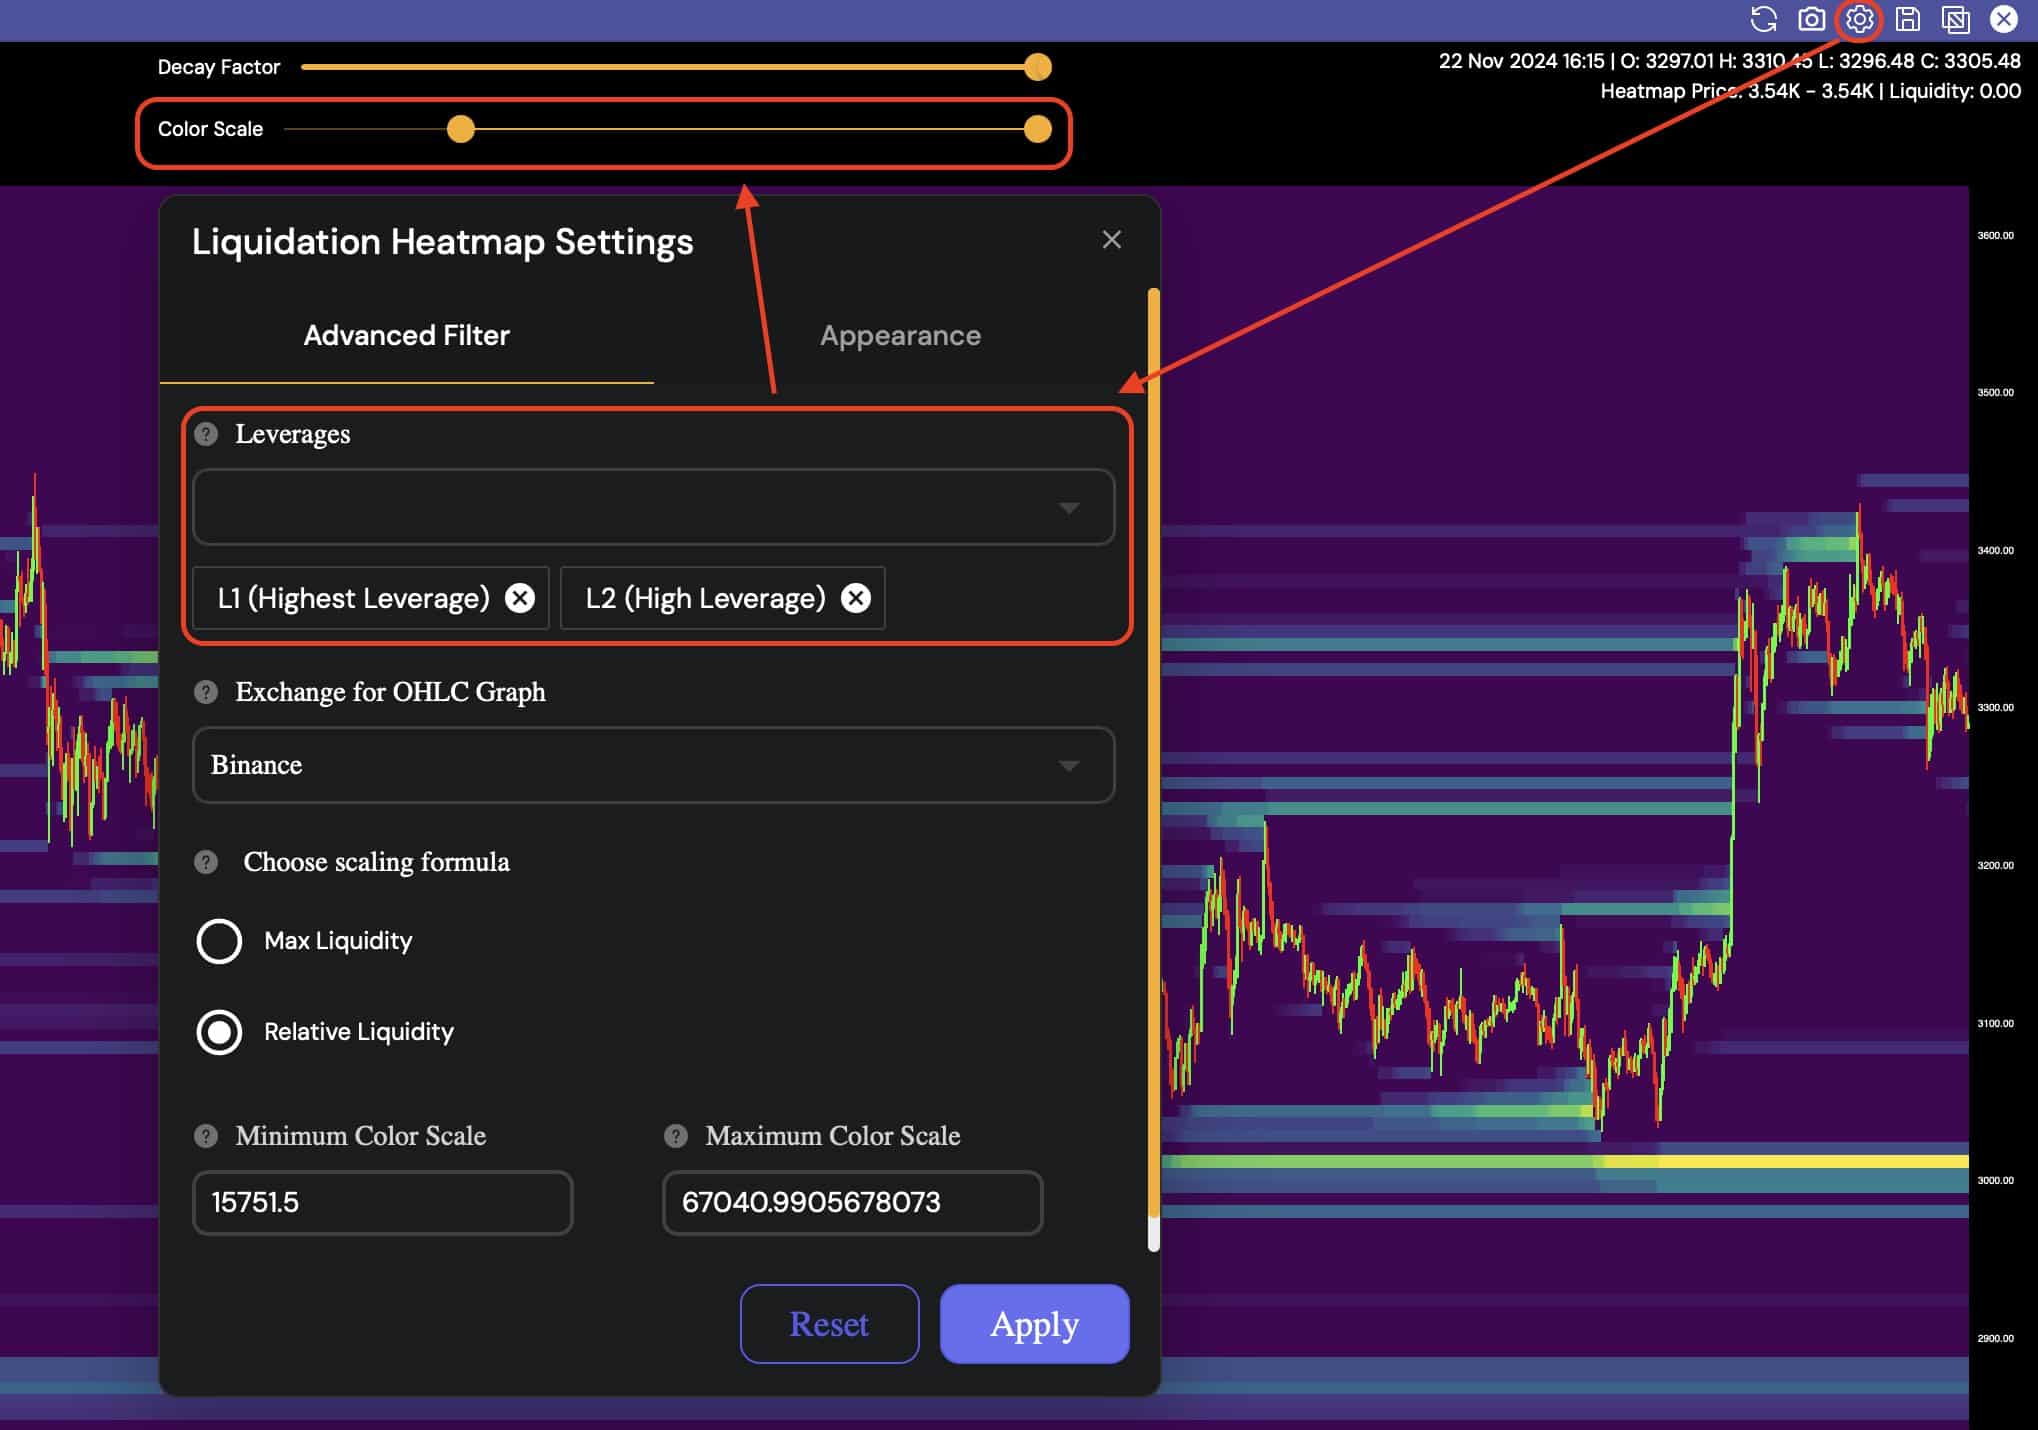
Again, high-leverage liquidations continued to loom over ETH’s price on the heatmap.
With adjustments set to focus only on high [L1 and L2], leverage showed critical areas where large liquidations could trigger significant price movements.
This adjustment helped highlight the major liquidation clusters, revealing the risk zones directly above the current price.
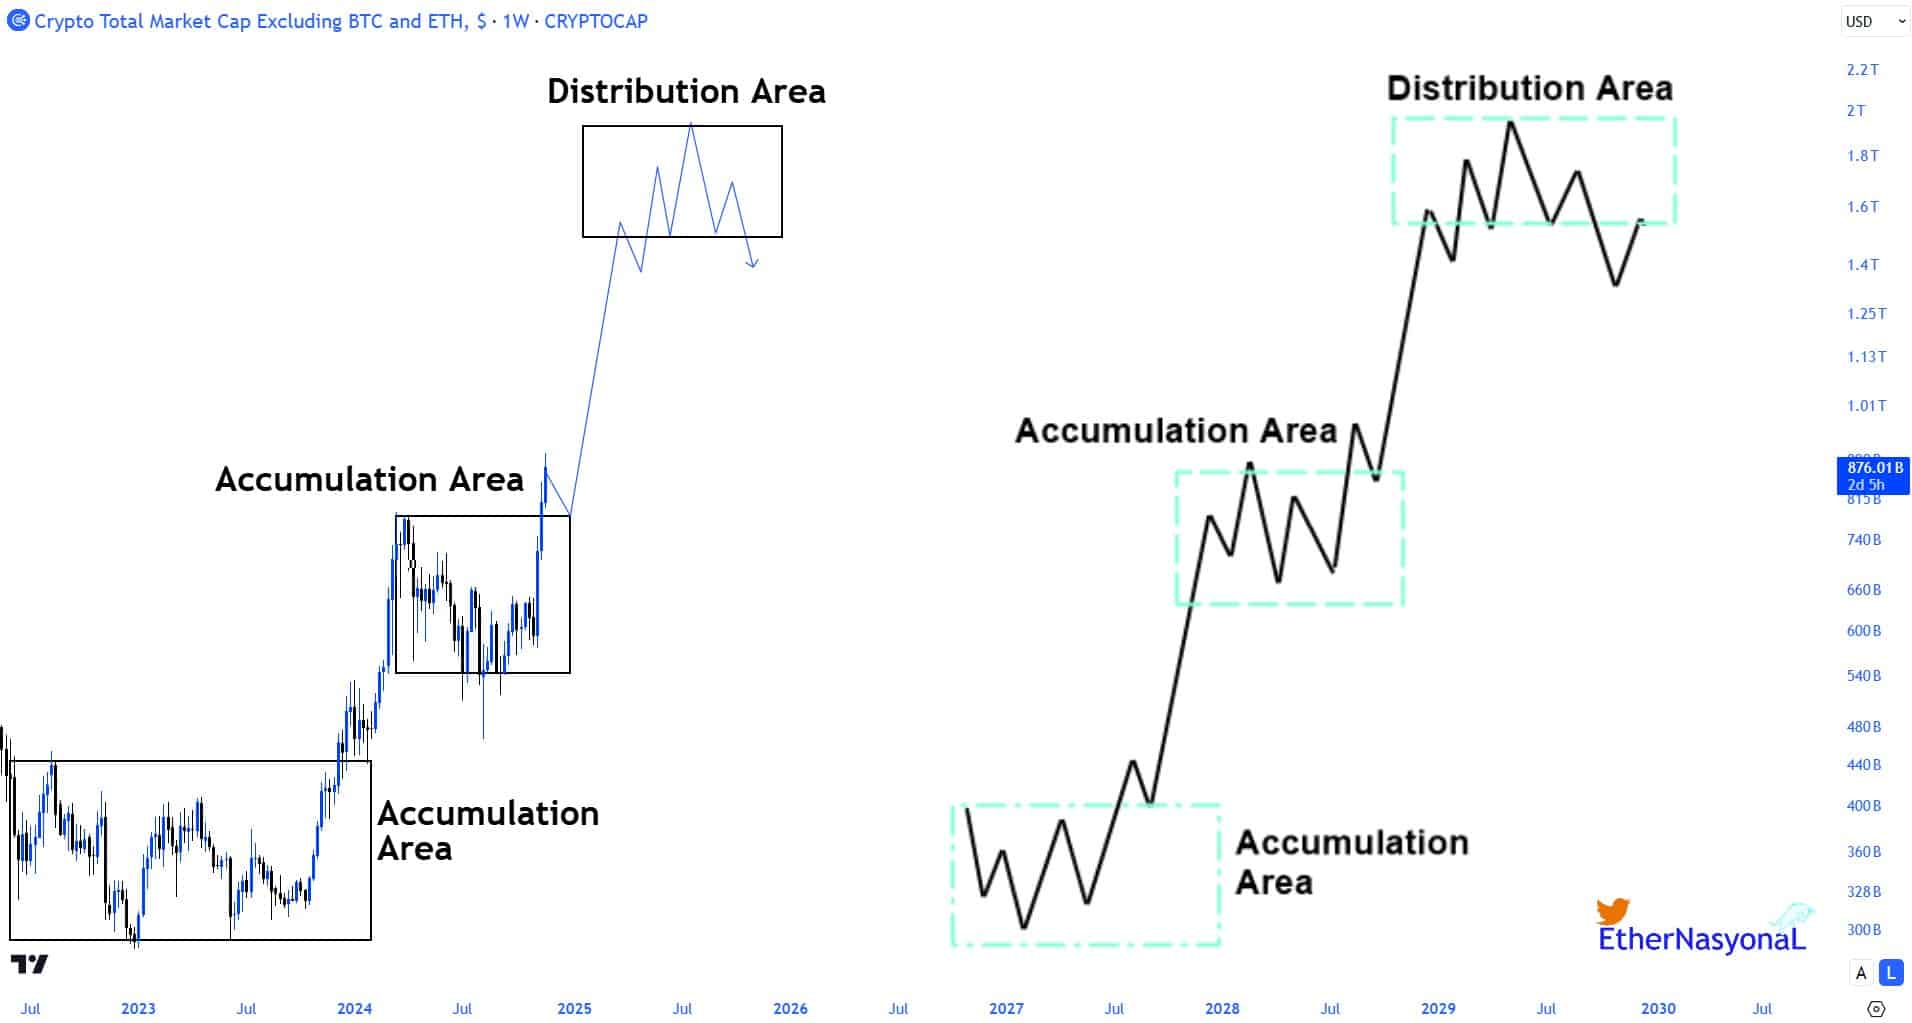
Finally, the altcoin market, represented by the TOTAL3 index, began its second parabolic phase in October 2023.
This movement marked a transition out of the Wyckoff method’s second accumulation zone, propelling altcoins into a strong uptrend.
The recent price actions saw altcoins retesting and then securely surpassing channel highs, eventually eclipsing the May 2024 peaks.
The current influx of capital was targeting large caps and select mid-cap altcoins, fueling this rally.
Read Ethereum’s [ETH] Price Prediction 2024–2025
Ethereum, despite a key player, has exhibited a slower but consistent rise, setting a solid foundation that diverges from Bitcoin’s more rapid surge.
This methodical climb could potentially lead to a change of behavior for the king of altcoins.


