- POPCAT seemed to have a bullish market structure on the daily timeframe
- Lower timeframes showed bullish sentiment was weak
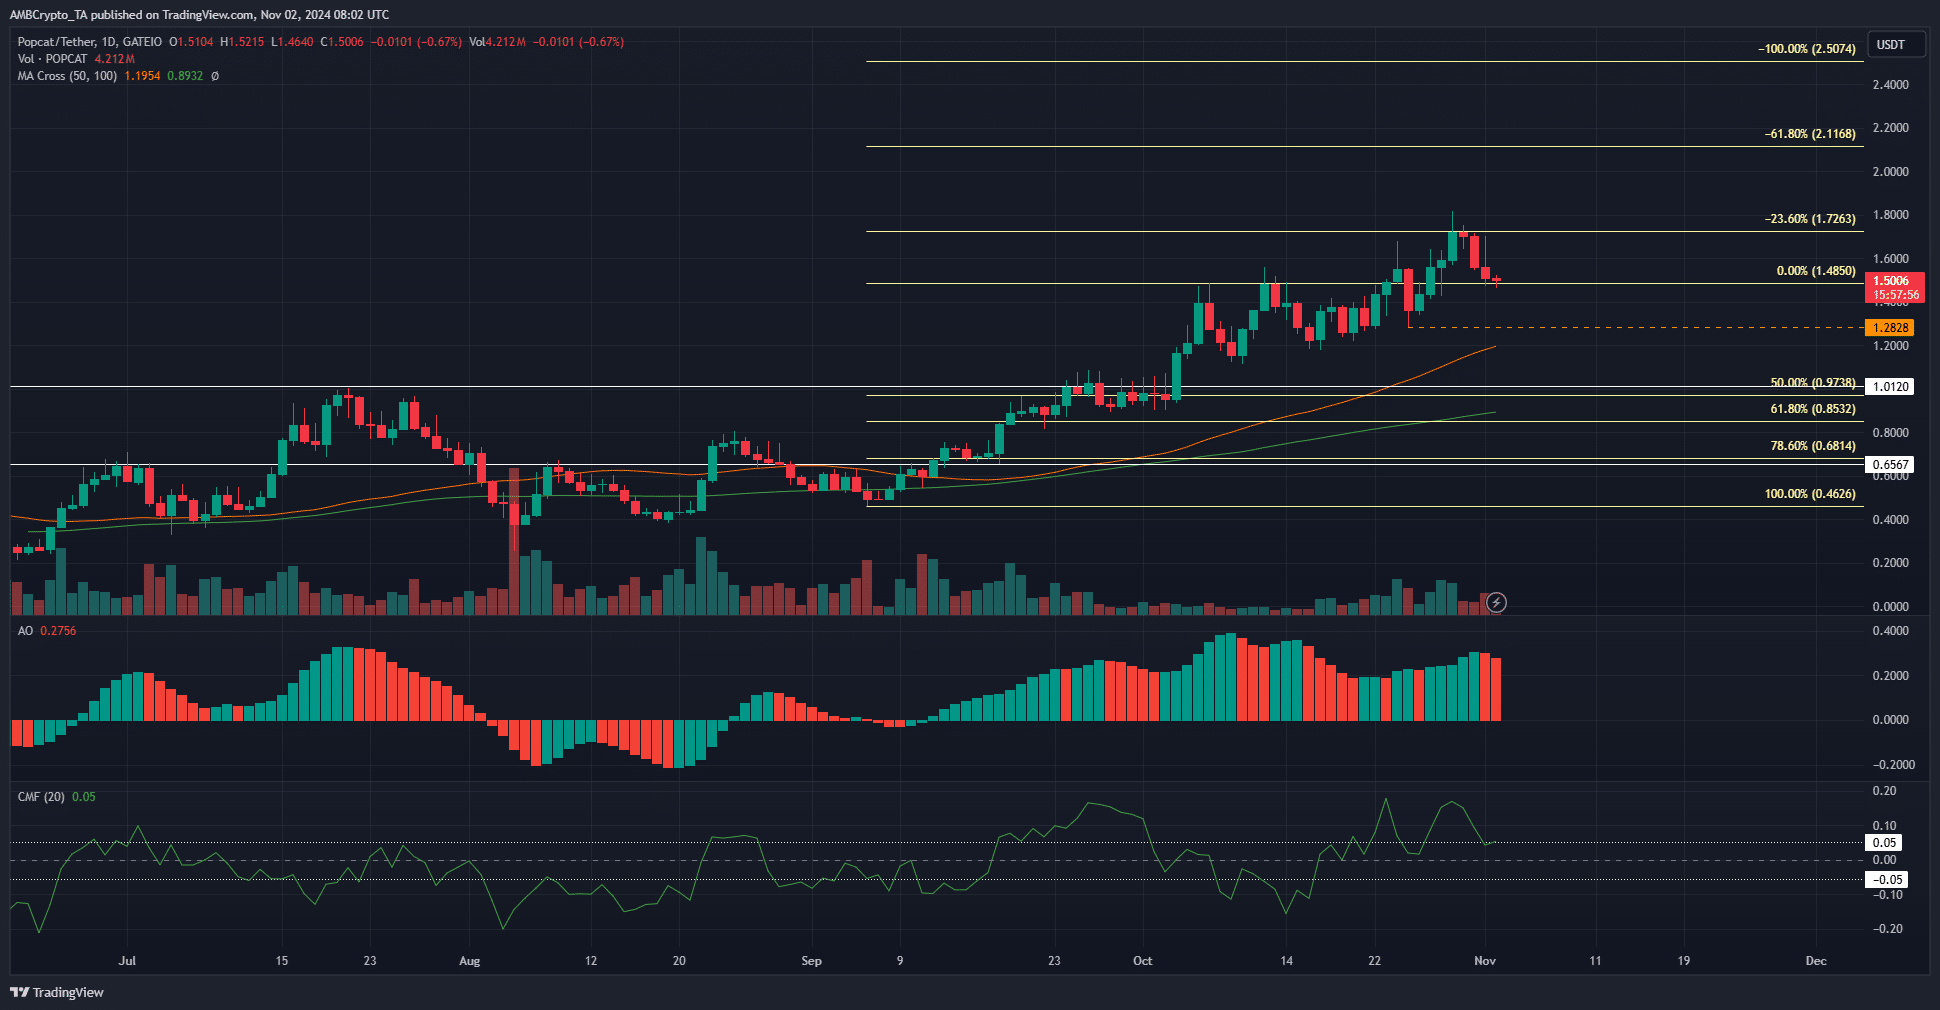
POPCAT was trending higher on the daily chart and registered a higher low at $1.28 on 25 October. Its momentum appeared to slow down around this time, but it managed to form a higher high in recent days.
Bitcoin’s [BTC] correction from $72.7k caught many overeager bulls offside. POPCAT also registered a 14.45% drawdown over the past three days, but may be likely to maintain its upward trend.
Market structure favors POPCAT bulls
The 23.6% Fibonacci extension level was tested and the correction took place from there. The higher highs and higher lows meant the market structure remained bullish. A daily session close below $1.28 would flip the structure bearishly.
To flip the trend bearishly, a new lower high and lower low must be set thereafter. Such a scenario would mean POPCAT is gearing up for a pullback, potentially below the $1-mark.
At the time of writing, this scenario did not appear likely. The CMF was at +0.05 to denote significant capital flows into the market. The Awesome Oscillator also highlighted the bullish momentum behind the memecoin since the second week of September.
Dwindling Open Interest hints at doubts


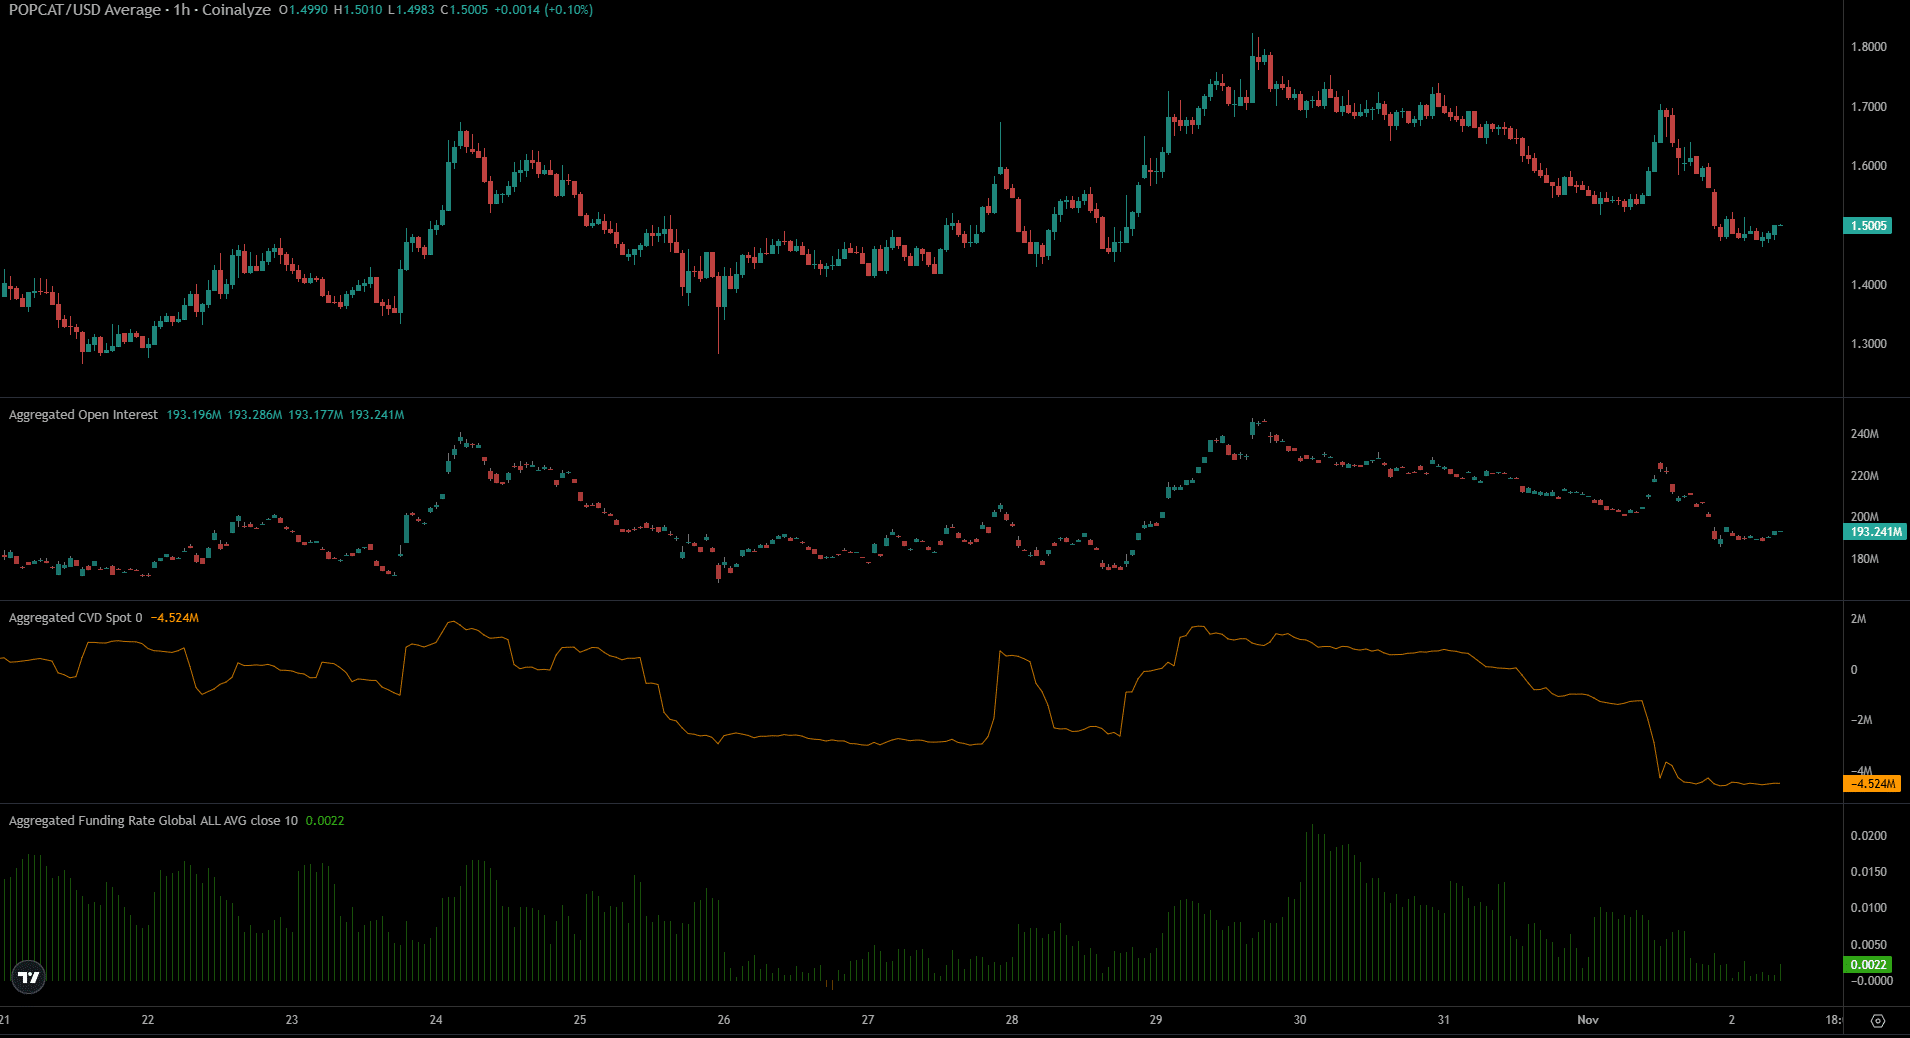
Source: Coinalyze
The price bounce beyond $1.5 a week ago saw the Open Interest slowly move higher. However, the correction from 30 October saw the OI fall alongside the price. This denoted bearish sentiment in the Futures market.
The spot CVD also fell a fair distance over the same period. This combination of lukewarm interest from buyers in Spot and Futures market showed bearish short-term sentiment, although the higher timeframe price action signaled bullishness.
Is your portfolio green? Check the Popcat Profit Calculator
The funding rate was close to zero – Another sign of weak bullishness. Overall, traders must exercise caution over the upcoming week. The 2024 elections in the United States represent some uncertainty that the market abhors. Clearer price trends are likely to establish themselves after this major event is decided.
Disclaimer: The information presented does not constitute financial, investment, trading, or other types of advice and is solely the writer’s opinion


![Raydium’s [RAY] 7-month high – All you need to know about it](https://hamsterkombert.com/wp-content/uploads/2024/11/Raydiums-RAY-7-month-high-–-All-you-need-to-know-150x150.png)
![Mapping how and why Dogwifhat [WIF] might surge by 60%](https://hamsterkombert.com/wp-content/uploads/2024/11/Mapping-how-and-why-Dogwifhat-WIF-might-surge-by-60.webp-150x150.webp)