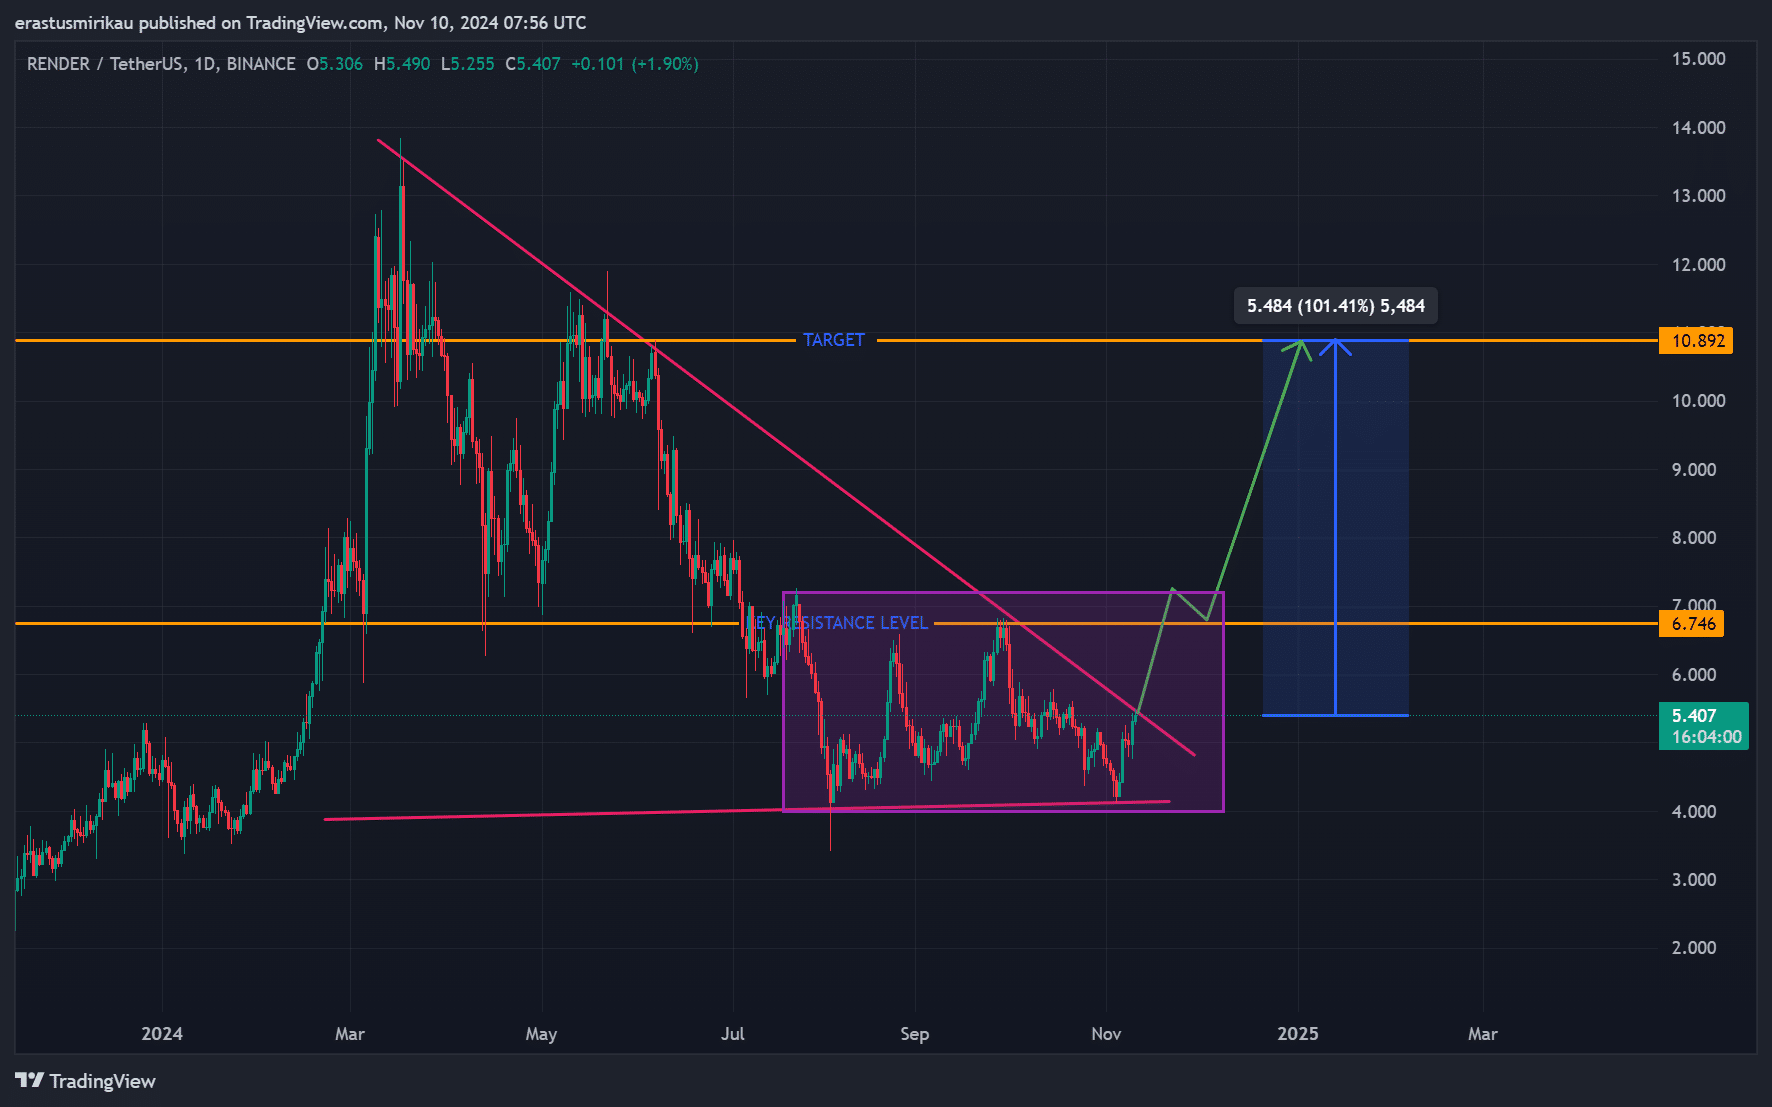
- A bullish pennant pattern and key resistance at $6.75 indicated potential upward momentum.
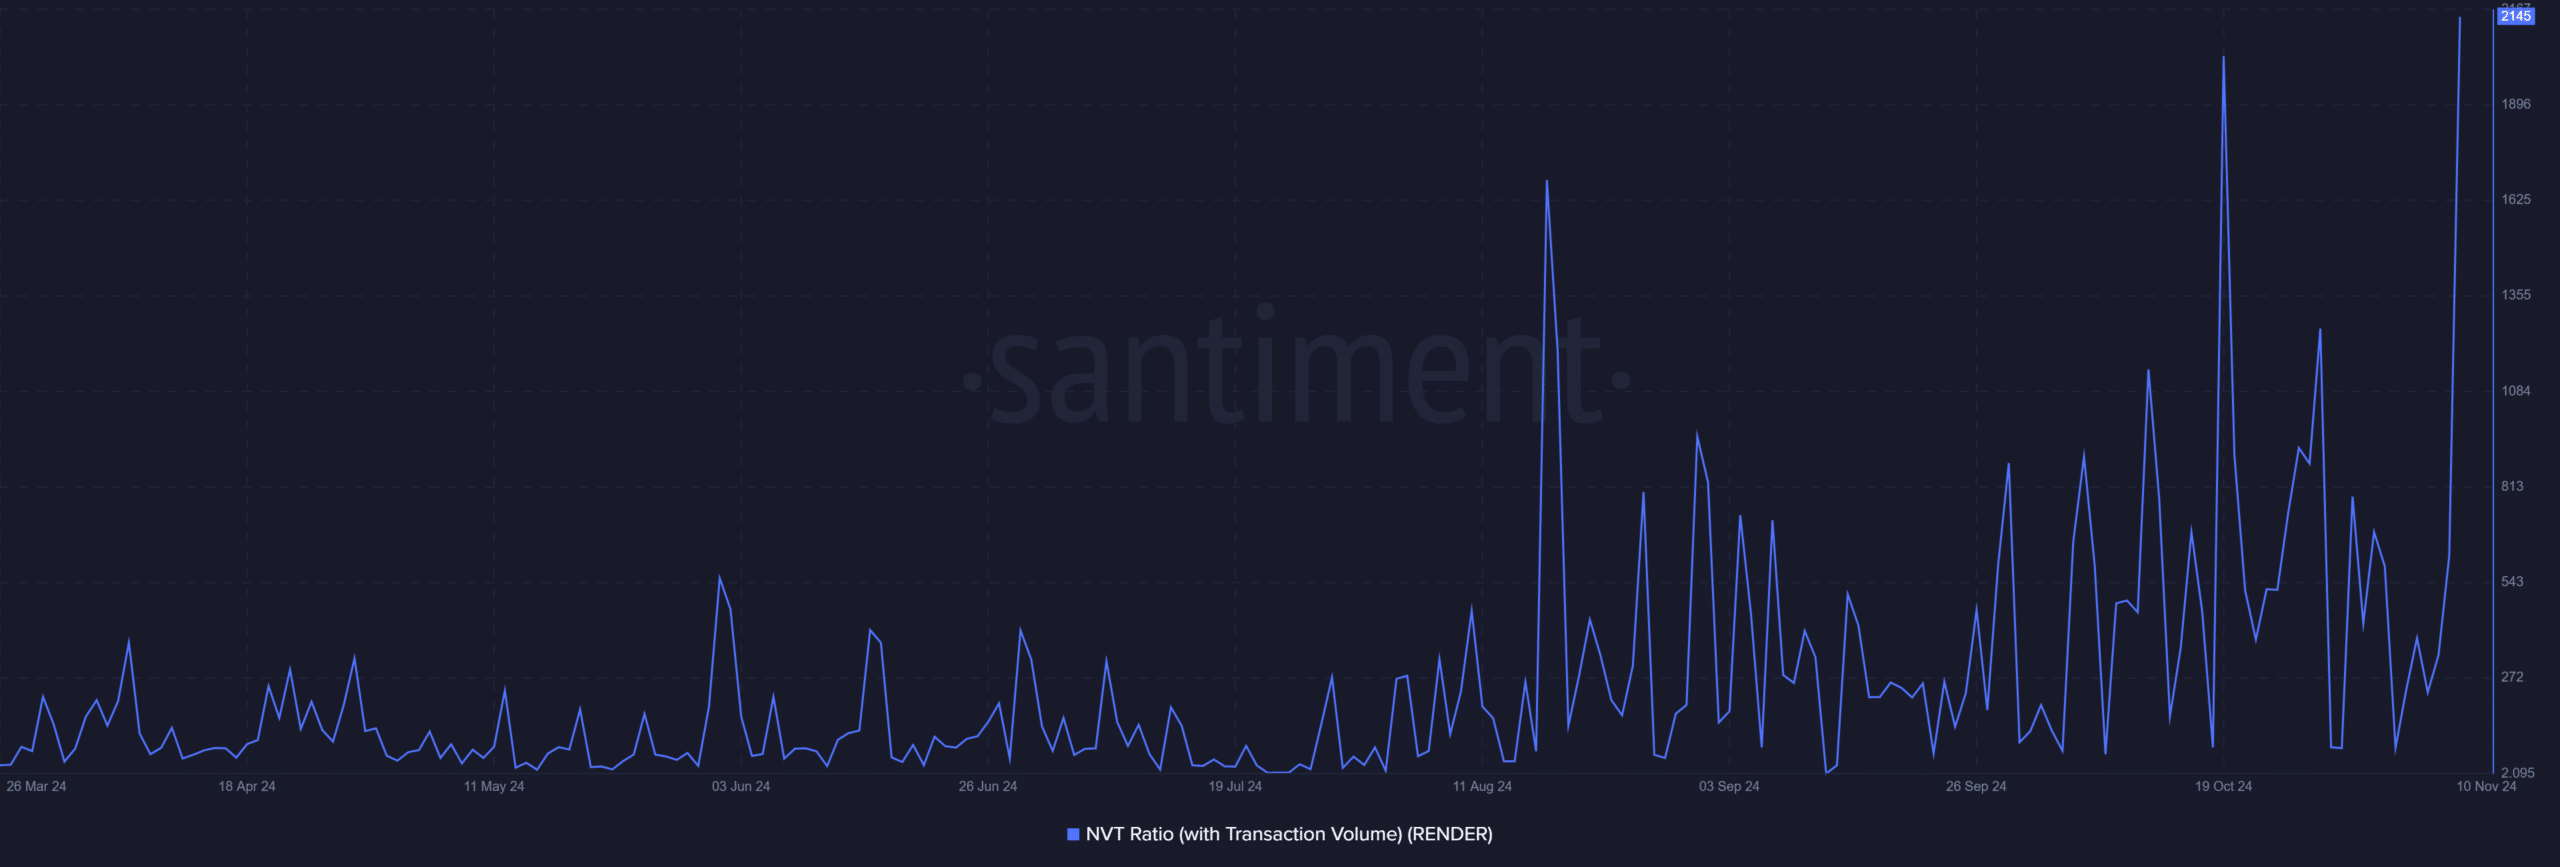
- On-chain data showed cautious optimism, with high NVT signaling strong speculative interest.
Render [RNDR] stands at a critical juncture, aiming to break free from a lengthy downtrend and capitalize on bullish momentum.
At press time, RNDR was trading at $5.41, up 6.16% in the past day. This momentum, combined with a bullish pennant formation, could push RNDR beyond its key resistance at $6.75.
If successful, RNDR may target the $10 to $15 range. However, will this rally continue, or will resistance hold firm?
Is RNDR primed for a breakout?
RNDR has been consolidating within a well-defined range of late, shaped by a descending trendline and a horizontal support level near $4.10.
This setup has formed a bullish pennant pattern, often a precursor to a strong upward move. The $6.75 resistance level serves as the immediate barrier.
A breakout at this level could validate the pattern, setting RNDR up for notable gains. The primary target for a successful breakout stood at $10.89, representing over 100% potential upside.
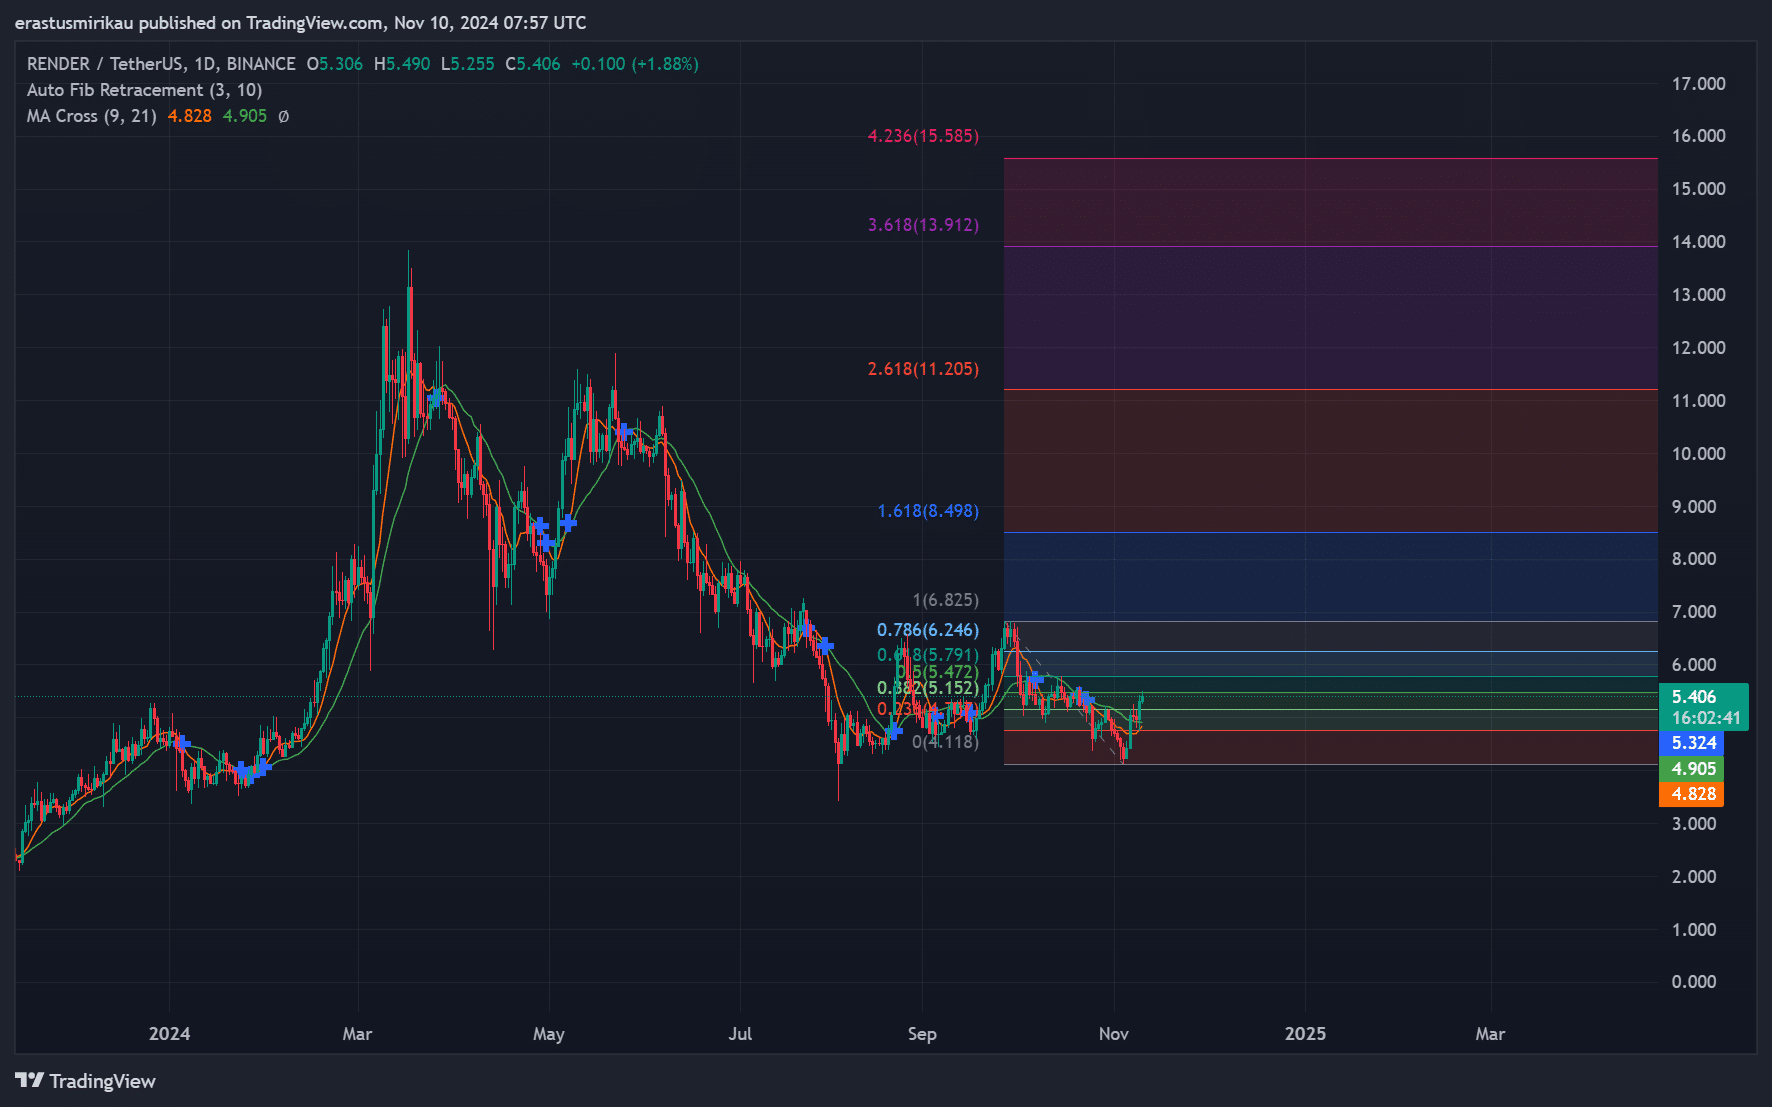
Additionally, the recent crossover between the 9-day and 21-day moving averages signals short-term bullish momentum.
This crossover often precedes upward moves, suggesting that traders may continue accumulating positions.
The combination of this moving average setup with rising volume strengthens the bullish outlook for RNDR, enhancing the likelihood of a breakout if favorable conditions persist.
Fibonacci retracement levels add further insight into possible price trajectories. The 0.786 level at $6.24 closely aligns with the critical $6.75 resistance, further emphasizing its importance.
Therefore, a decisive move beyond this range could propel $RNDR toward higher Fibonacci extensions, with targets at $8.49, $11.20, and possibly $15.58.
Mixed signals but a bullish lean
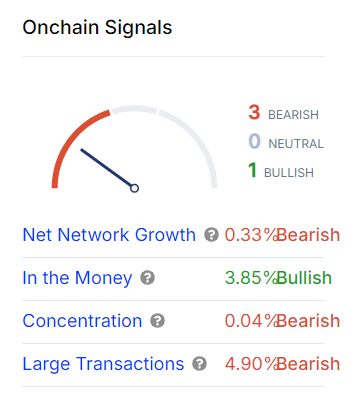
On-chain metrics offer a nuanced view. Net Network Growth showed a modest decline of 0.33%, indicating limited new user activity.
However, the “In the Money” metric revealed that 3.85% of holders were in profit, suggesting that some investors see gains, which may encourage them to hold as they anticipate further appreciation.
Conversely, large transactions have decreased by 4.9%, indicating caution among major holders.
Therefore, while on-chain data shows a mix of sentiment, the overall trend leans slightly bullish as more holders find themselves in profitable positions, enhancing holding sentiment.
RNDR NVT ratio signals speculative interest
Render’s NVT ratio, standing at 2145.55, hinted at potential overvaluation relative to transaction volume.
However, in bullish markets, high NVT ratios often reflect speculative interest, suggesting traders expect price appreciation.
Therefore, while high NVT may signal caution, it could also indicate strong demand as investors anticipate further gains.
Conclusively, Render Token’s technical setup indicates a strong chance of breaking the $6.75 resistance, potentially propelling RNDR to new highs.
Read Render’s [RNDR] Price Prediction 2024–2025
While on-chain signals are mixed, the bullish pennant and recent momentum suggest a likely continuation toward midterm targets of $10 and beyond if the breakout materializes.
Traders should monitor this level, as a decisive move above could confirm the next upward phase for RNDR.


