- SHIB’s breakout from a falling wedge pattern hints at strong bullish momentum, with immediate resistance at $0.00001911.
- Positive technical indicators and reduced exchange reserves support SHIB’s potential upward trajectory.
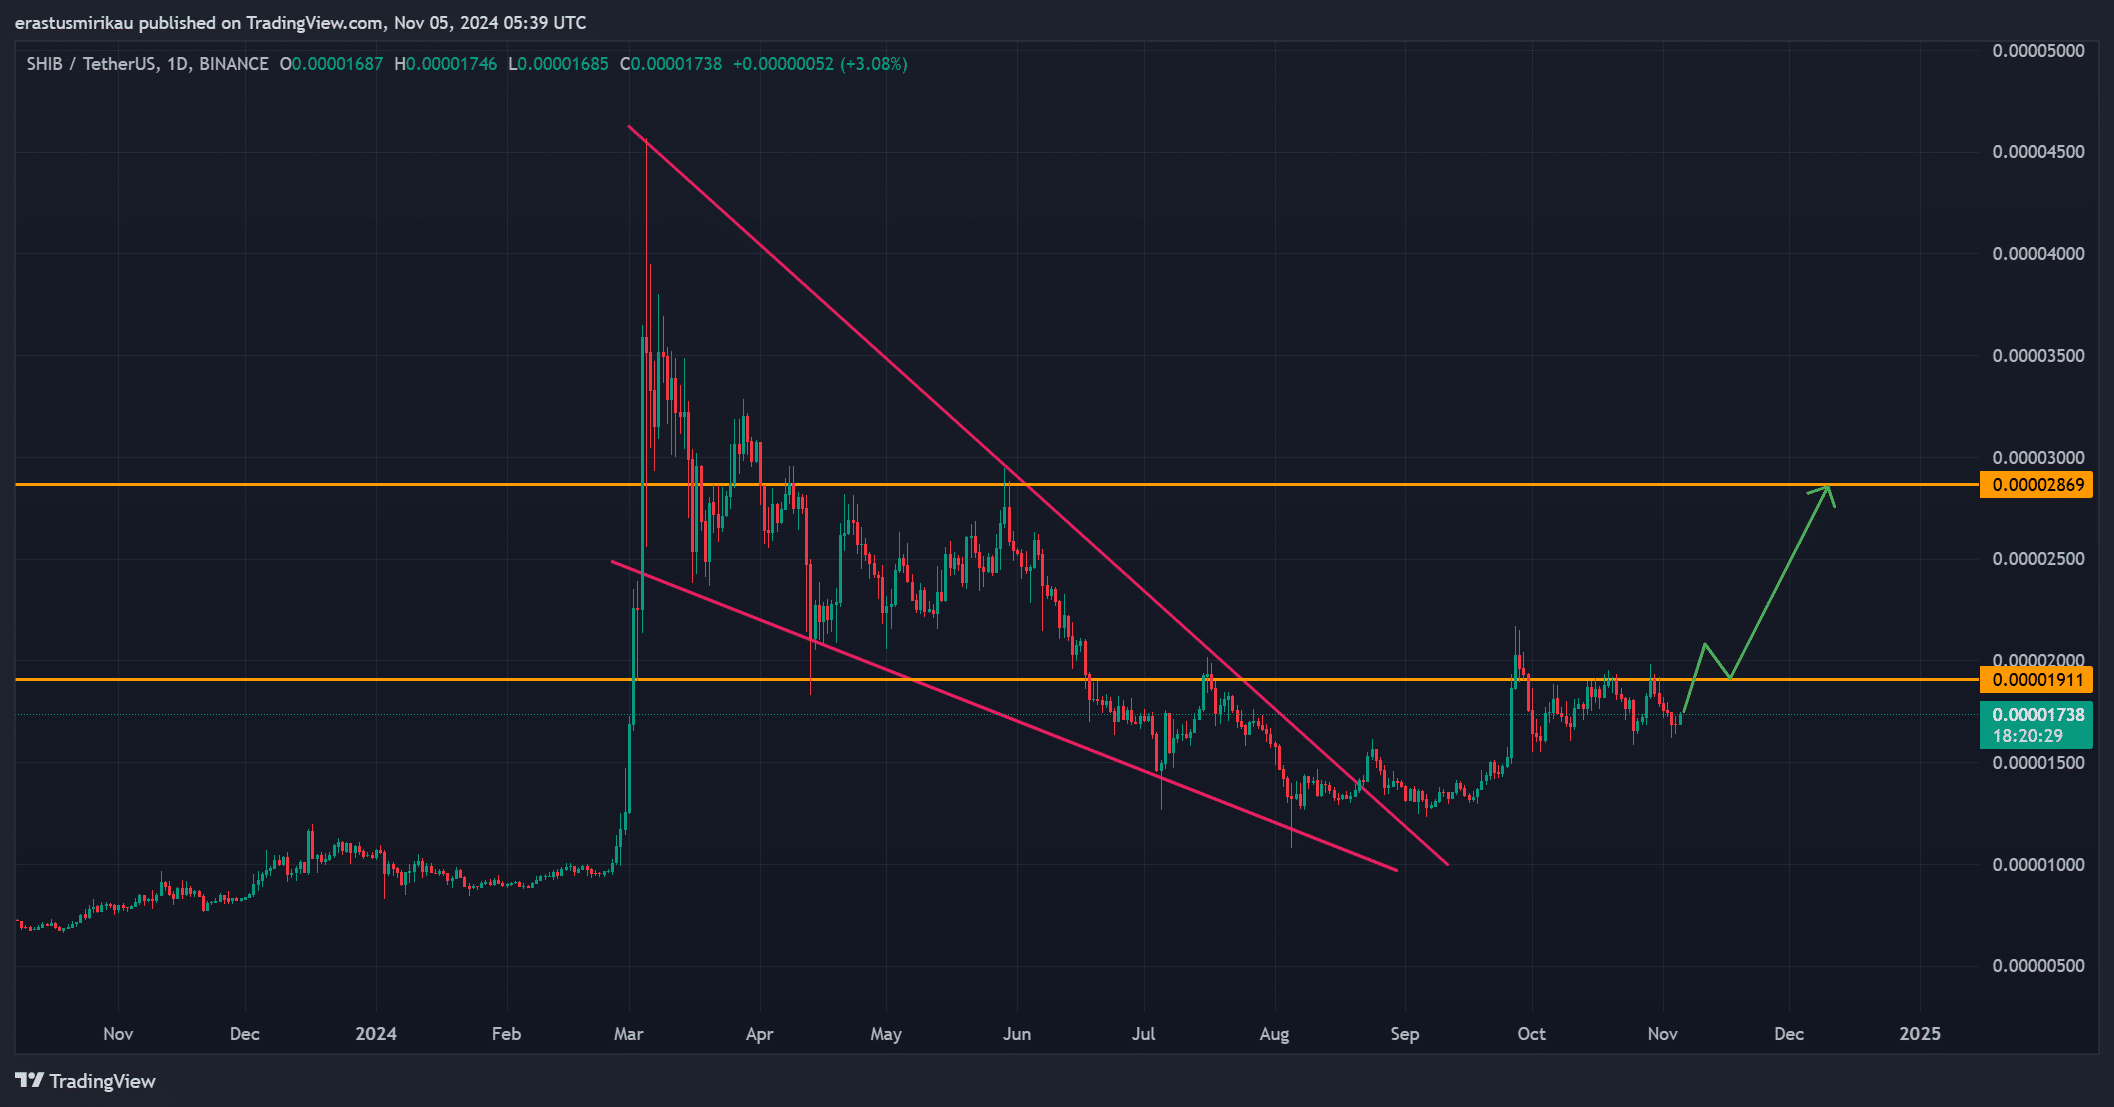
Shiba Inu [SHIB] has shown strong bullish signals, recently breaking out from a falling wedge pattern on its daily chart. This breakout suggests a potential shift in momentum for SHIB as it pushes toward higher levels.
At press time, SHIB trades around $0.00001735, up 3.21% over the last 24 hours.
The token now faces immediate resistance at $0.00001911, with a more challenging barrier at $0.00002869. Therefore, a successful breakthrough could confirm sustained bullish momentum.
Can Shiba Inu overcome these key resistances and reignite broader market interest?
Does the falling wedge breakout signal a new rally?
SHIB’s recent breakout from a descending wedge pattern, a classic bullish reversal, hints at renewed strength. The chart reveals SHIB nearing its first resistance at $0.00001911, and momentum indicators seem to support this upward trend. Should Shiba Inu clear this level, it will then face a stronger barrier at $0.00002869.
Consequently, breaking through both could indicate a longer-term bullish trend, potentially drawing more market interest. However, this setup will need follow-through momentum—can SHIB capitalize on this breakout?
Stochastic RSI and MACD show momentum shift
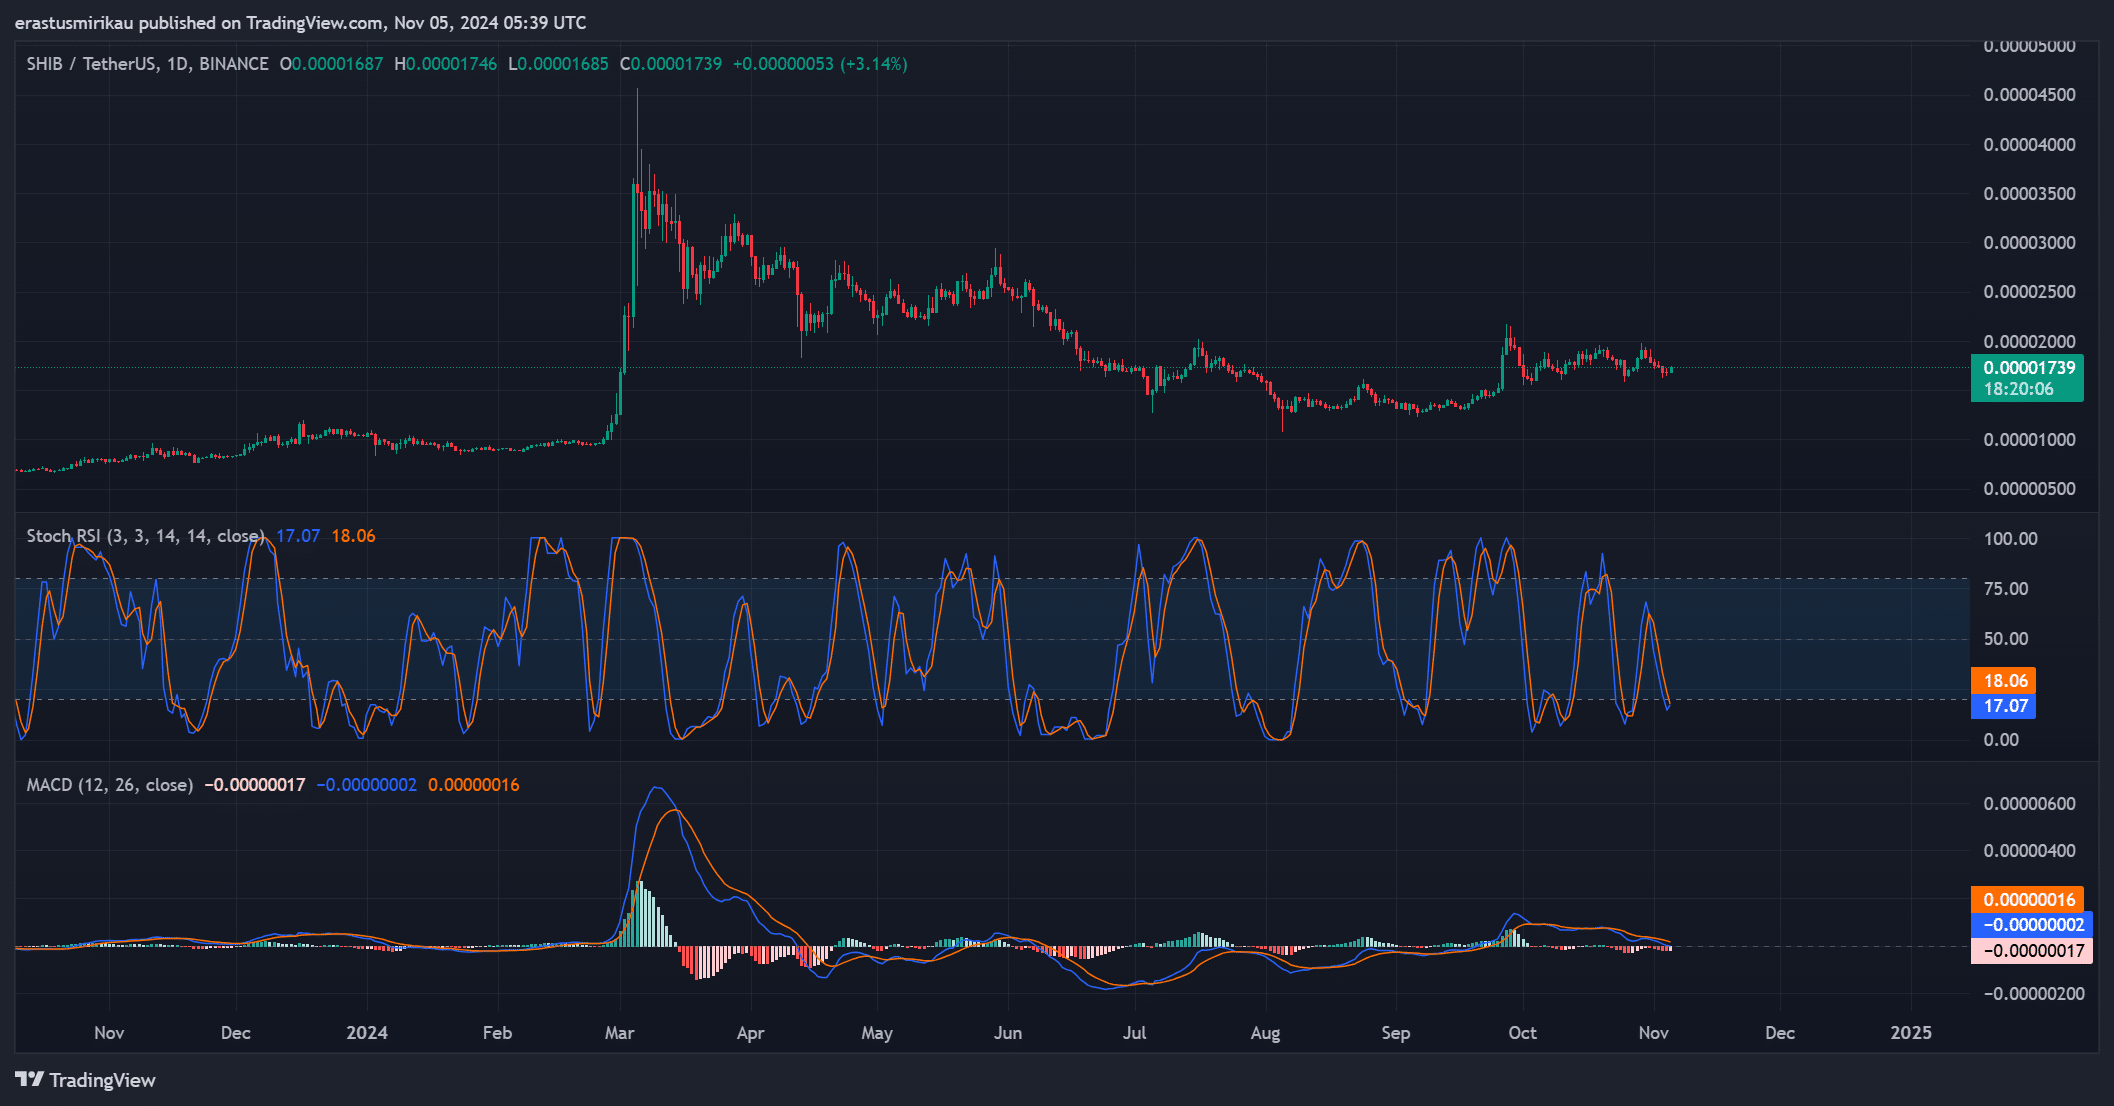
Analyzing SHIB’s Stochastic RSI reveals an optimistic picture. The Stochastic RSI sits at 17.07 (blue line) and 18.06 (orange line), hinting at an oversold condition that often precedes a price rebound.
This indicator’s recent upward movement could signal a stronger uptrend if it crosses above 20.
Additionally, the MACD supports this momentum shift. The MACD line is approaching zero, showing early signs of a bullish crossover. Therefore, the combination of the Stochastic RSI and MACD signals points to potential buying pressure.
Declining exchange reserves reduce selling pressure
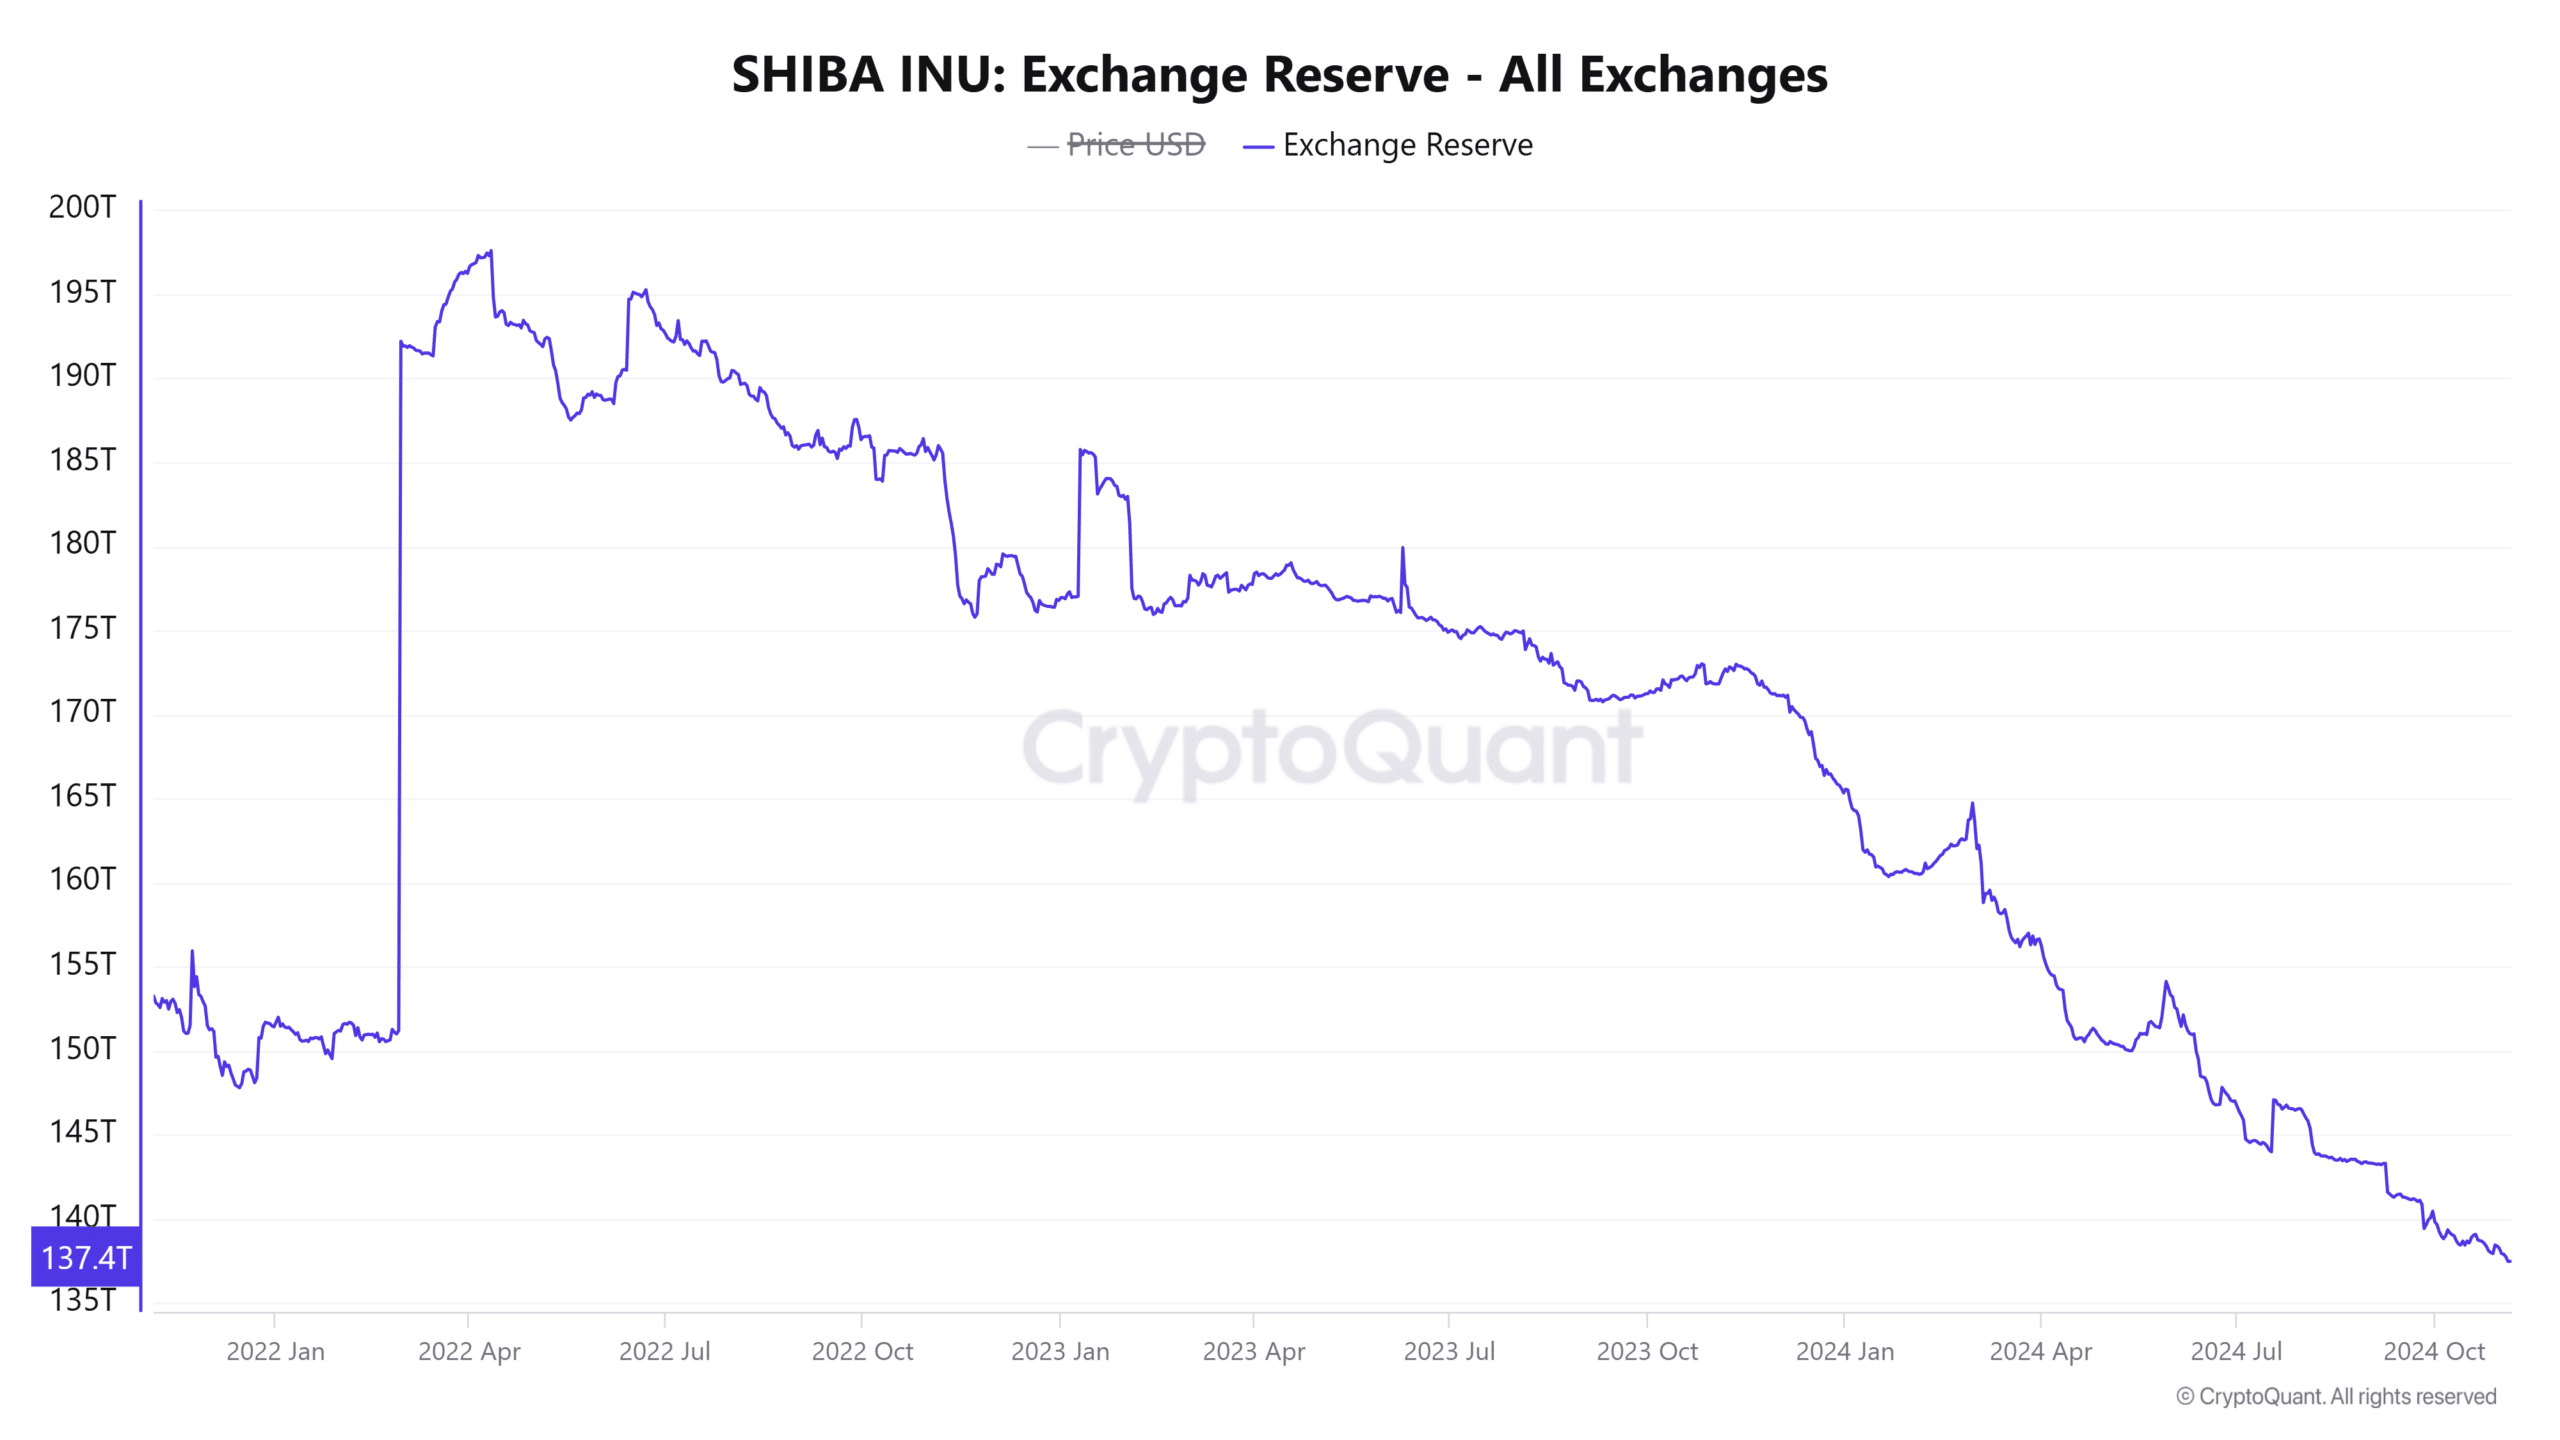
The exchange reserves currently stand at 137.4918 trillion tokens, showing a 0.21% drop in the last 24 hours. A decline in exchange reserves implies fewer tokens are available for sale, consequently reducing selling pressure.
This trend aligns well with SHIB’s bullish outlook, indicating that holders are moving tokens off exchanges in anticipation of gains.
Bullish sentiment in long/short ratio supports rally
SHIB’s long/short ratio stands at 1.1013, with 52.41% of positions long and 47.59% short. This bullish tilt suggests the market favors upward movement, with more long positions than shorts.
Consequently, a sustained higher ratio could reinforce SHIB’s momentum, supporting its ability to challenge near-term resistance.
Is your portfolio green? Check out the Shiba Inu Profit Calculator
Can SHIB sustain this momentum?
With strong technical support from indicators like the Stochastic RSI, MACD, and a bullish long/short ratio, SHIB appears poised to continue its upward trend.
If SHIB can break through the critical resistance levels at $0.00001911 and $0.00002869, it is likely to sustain its rally and possibly attract greater market interest. For now, SHIB seems ready to push higher and could solidify its bullish momentum in the near term.


