- Traders seemed to be over-leveraged at $156.7 on the lower side and $166.5 on the upper side
- SOL’s on-chain metrics with technical analysis suggested that bulls have been dominating the asset
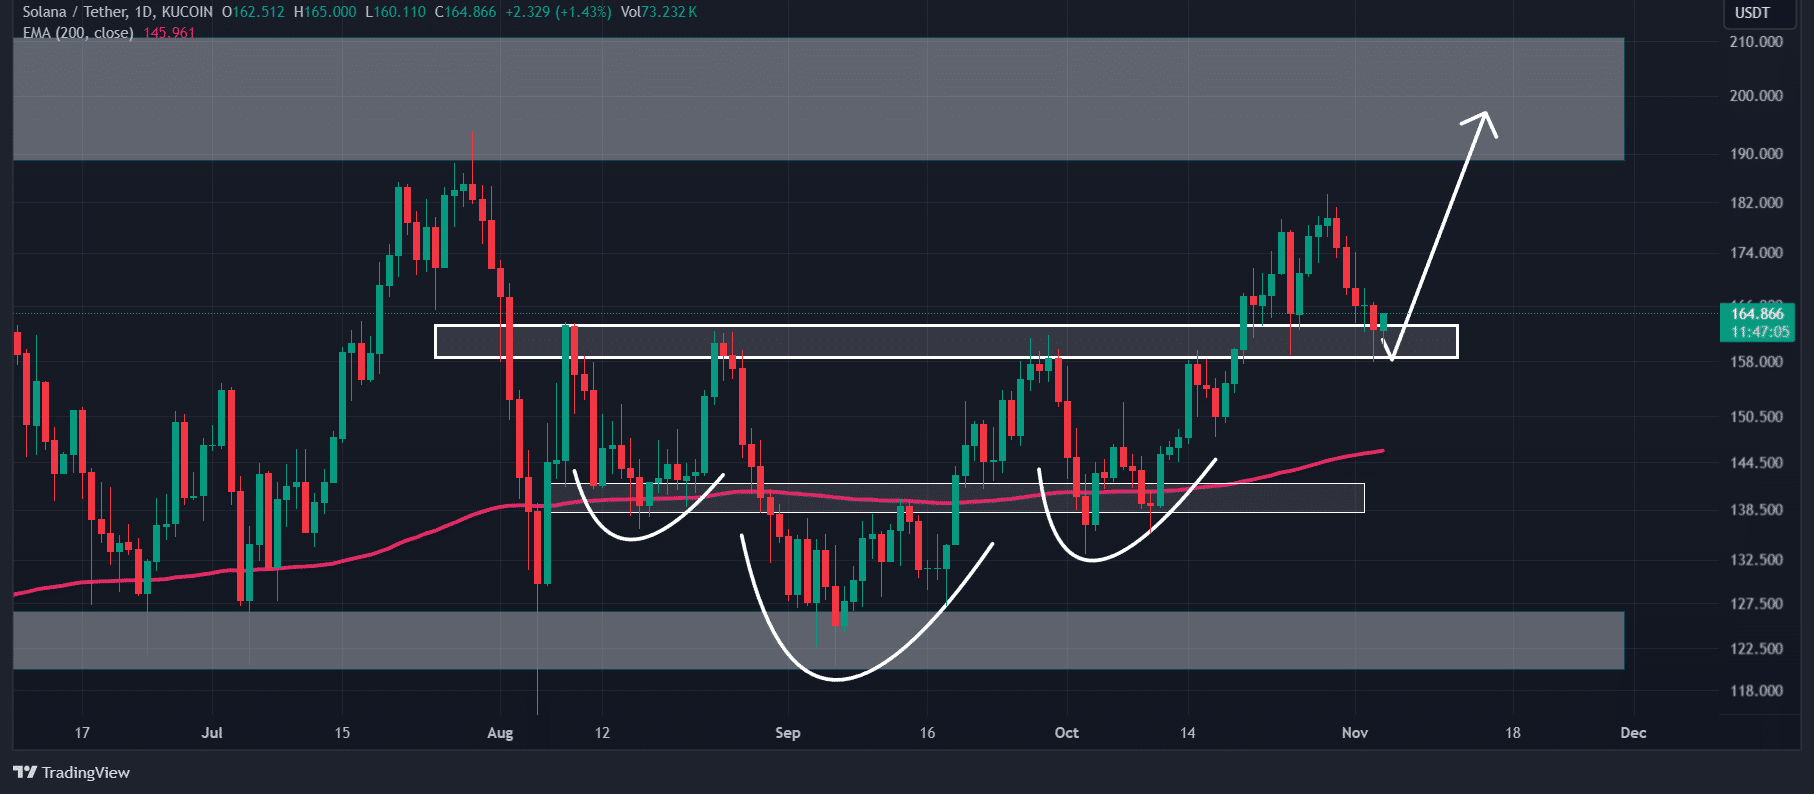
The wider market’s recent price decline pushed Solana (SOL) to the breakout level of its inverted Head and Shoulder price action pattern. At the time of writing, SOL appeared to be retesting this level following a breakout on the charts.
Market sentiment
And yet, the prevailing market sentiment seemed to be uncertain. Especially in light of the market showing slight signs of recovery after a significant decline.
In fact, some believe the aforementioned bout of depreciation was a correction phase. Others believe the market fell owing to general uncertainty thanks to the upcoming elections in the U.S, geopolitical tensions, and other factors.
Solana price analysis and key levels
Despite these factors, however, SOL’s technical analysis suggested a bullish outlook and hinted at a potential upside rally in the coming days.
According to AMBCrypto’s price analysis, SOL, at press time, was at a crucial support level of $161. It was recording a price reversal on the four-hour timeframe.
Based on the altcoin’s recent price action and historical momentum, if SOL closes a daily candle above the $167-level, there is a strong possibility that the asset could soar to $195 or even higher.
At press time, SOL appeared bullish as it was trading above the 200 Exponential Moving Average (EMA) on both the four-hour and daily timeframes.
Meanwhile, its Relative Strength Index (RSI) hinted at a potential upside rally in the coming days, with the same in oversold territory.
Bullish on-chain metrics
On-chain metrics further supported SOL’s positive outlook. According to the on-chain analytics firm Coinglass, SOL’s Long/Short ratio had a value of 1.02 at press time – The highest since the market began to decline. A ratio above 1 is a sign of bullish sentiment among traders.
However, SOL’s Open Interest dropped by 7% over the last 24 hours, indicating that traders liquidated positions due to the recent price decline. Additionally, traders may be hesitant to build new positions at this time.
Key liquidation levels
Right now, the major liquidation levels are at $156.7 on the lower side and $166.5 on the upper side, with traders over-leveraged at these levels.
If the market sentiment remains bullish and the price rises to the $166.5-level, nearly $57.6 million worth of short positions will be liquidated. Conversely, if the sentiment shifts and the price falls to the $156.7 level, approximately $120 million worth of long positions will be liquidated.
When combining these on-chain metrics with technical analysis, it appeared that bulls have been dominating the asset. Simply put, there’s potentially a good price rally in SOL’s near term.


