- Solana had a bearish structure and momentum on the 1-day timeframe
- Sustained buying pressure would be necessary for a recovery, but it hasn’t arrived yet
Solana [SOL] has been in a retracement phase over the last six weeks after facing rejection above the $260-level. There seemed to be strong social volume around the asset, but decreasing active addresses have been a concern. In fact, Pumpfun deposited $21 million worth of SOL on the centralized exchange Kraken, sparking fears of short-term sell pressure.
Its MVRV ratio analysis underlined a potential buying opportunity. At the same time, the price was trading just above a demand zone that acted as a stern resistance in mid-2024.
Solana remains bearish on the daily timeframe
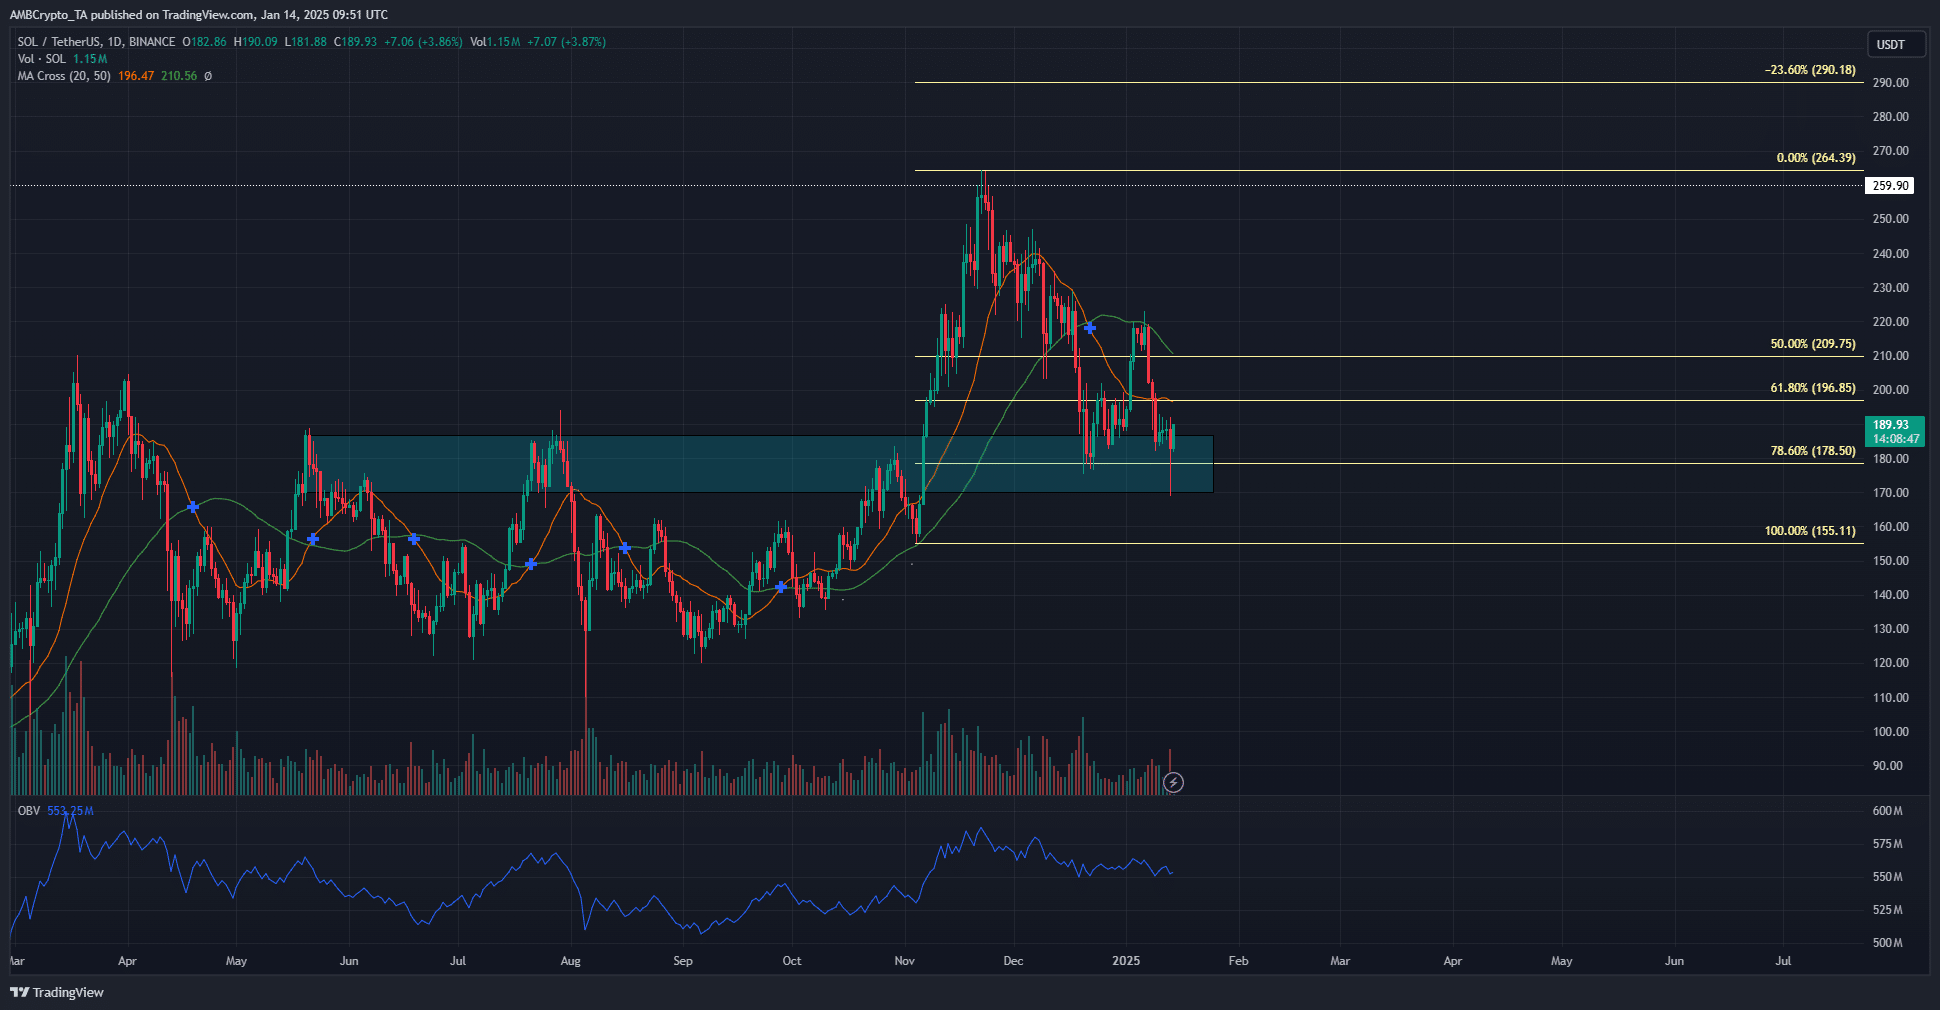
The market-wide slump in recent weeks after the November pump has affected SOL negatively. With Bitcoin [BTC] dropping to $89.2k on Monday, 13 January, it was a wonder that Solana bulls held on to the $180-support.
The OBV has been on a steady decline since November, despite the buyers’ resolute defense. This meant that sooner or later the demand zone would be overrun unless sentiment across the market changes bullishly.
The 20 and 50-period moving averages helped highlight potential turning points. At press time, they reflected bearish momentum, and the slower moving average served as a short-term resistance.
The price action also told the same story. In order to flip the daily structure bullishly, SOL must climb past the $218.2 lower high it formed just over a week ago.
Short-term sentiment bearish as well


Source: Coinalyze
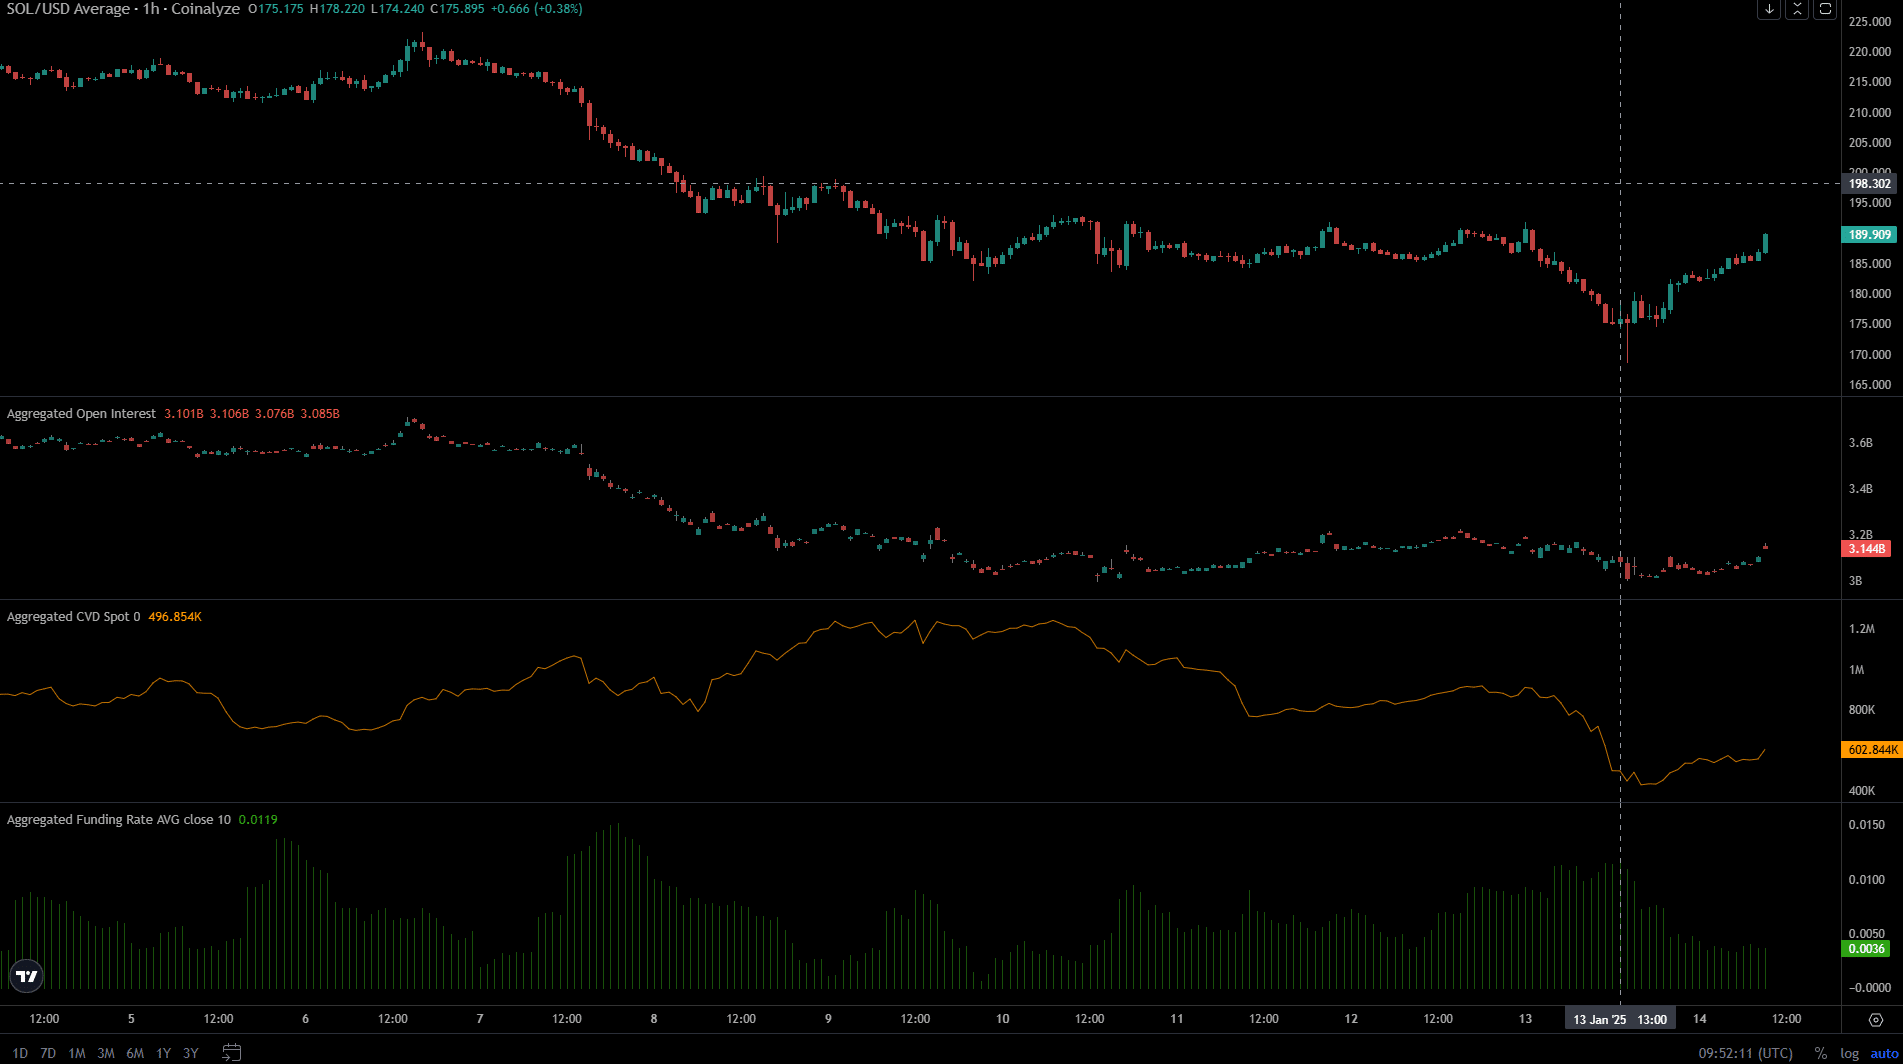
The hourly chart from Coinalyze also highlighted a lack of belief in Solana’s short-term bullish prospects. The price bounce from $170 in the last 24 hours was accompanied by a hike in Open Interest. This hike was not enough to shift the OI trend, which indicated neutral sentiment and speculative inactivity for the most part.
Realistic or not, here’s SOL’s market cap in BTC’s terms
This detached outlook was also present on the spot CVD indicator, which has made lower highs over the past week. A change in this downtrend would be a signal that buyers were dominant once again.
Disclaimer: The information presented does not constitute financial, investment, trading, or other types of advice and is solely the writer’s opinion


