- LCX flipped its daily market structure bullishly, gaining by 43% in a day
- High trading volume and rising capital inflows meant more gains were possible
LCX [LCX] regained a bullish market structure on the 1-day timeframe for the first time in nearly two months. In fact, the exchange token of the LCX cryptocurrency exchange has been on a persistent downtrend since June.
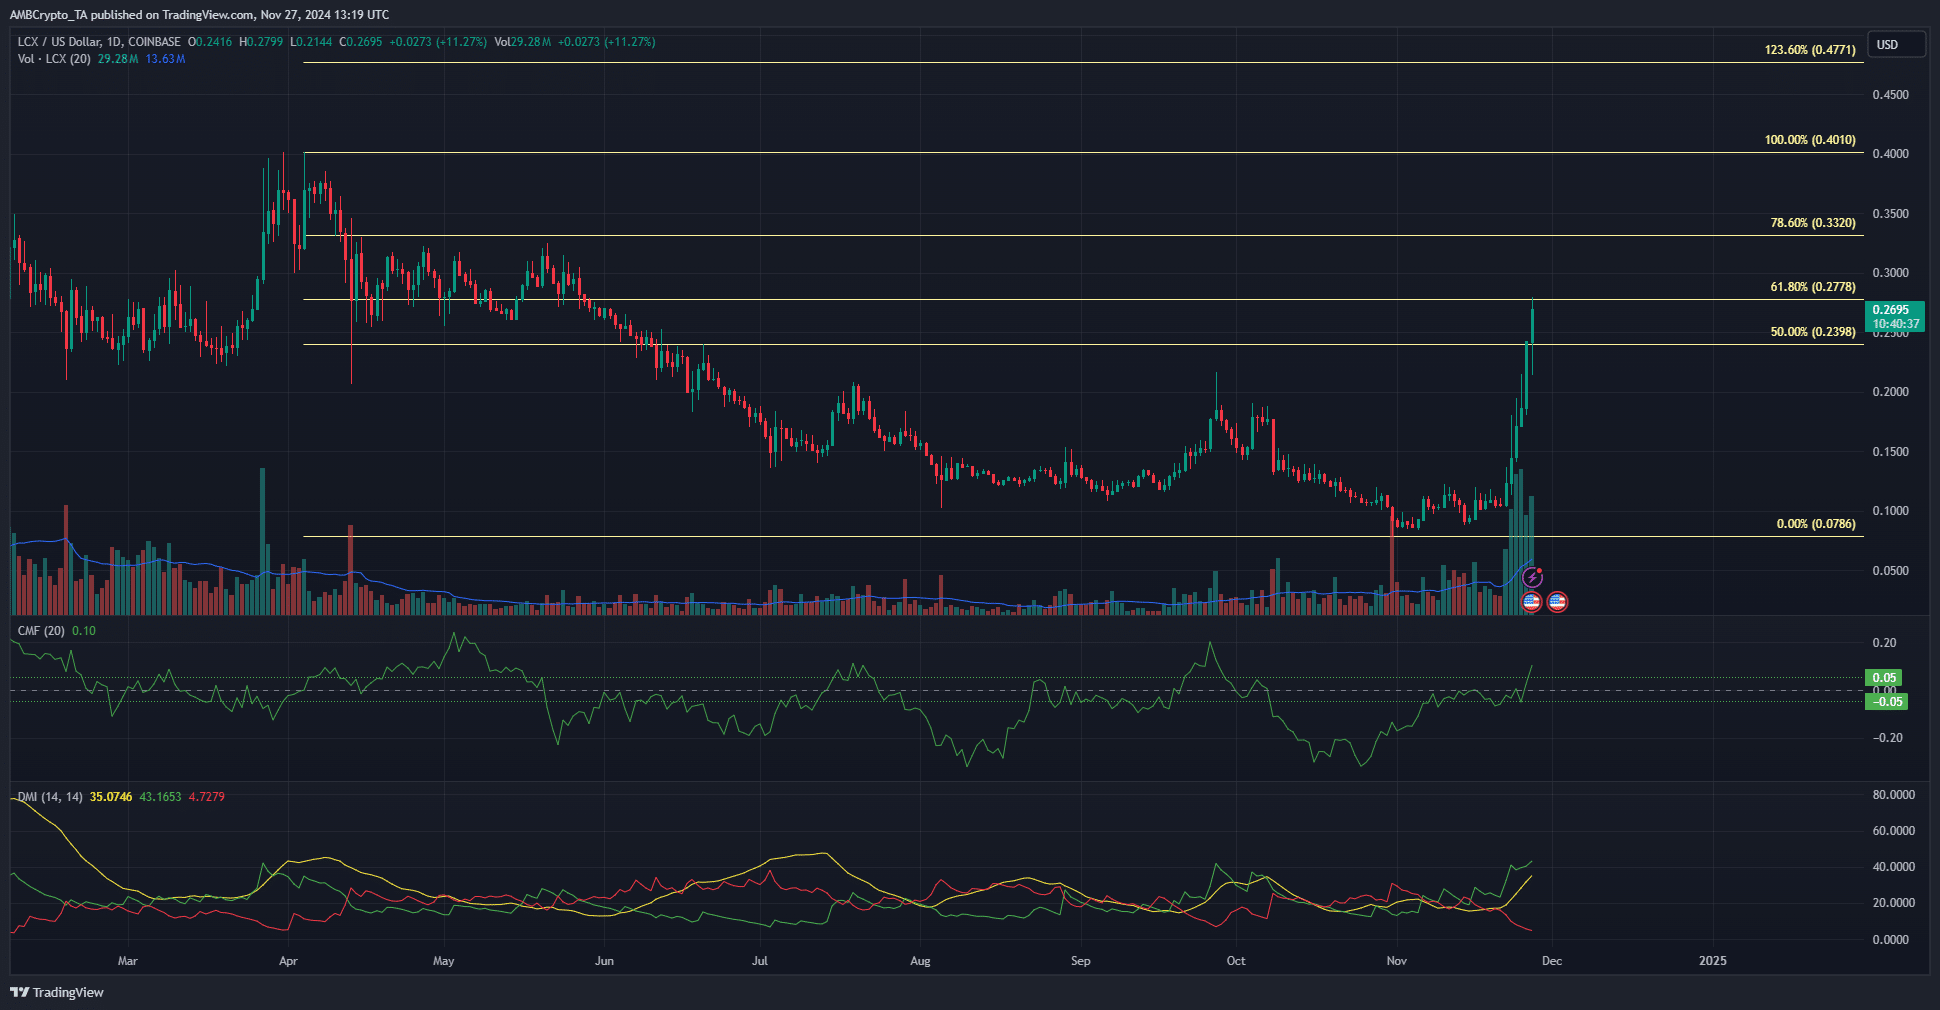
From 5 June to 31 October, the token shed 70% of its value. It took a couple of weeks to form a range around the $0.1-mark and consolidate. However, over the past week, it has gained by 163%.
At press time, it was up by 43% in the last 24 hours, having climbed past the $0.24-level which was expected to serve as resistance. How much higher can LCX go?
The importance of $0.2-$0.25 for LCX
In March, the $0.223-$0.232 region served as a demand zone. It saw a rally to $0.4 in the final week of March, before a pullback began. This turned into a downtrend after the $0.32 area was flipped to resistance.
At press time, LCX was trading at $0.2695, having hit $0.2778 in recent hours. It was able to burst past the $0.223 resistance zone without too much trouble.
The trading volume increased from $4.43 million on 21 November to $16.16 million on 22 November and hit $35.9 million on 25 November. This high trading volume, alongside the quick price gains, can be seen as a strong positive sign.
Read LCX’s [LCX] Price Prediction 2024-25
As shown above, the Fibonacci retracement levels were plotted because even though the market structure was bullish, the long-term trend has been bearish. LCX token needs to beat the $0.332-level to claim it is beginning a strong, sustainable uptrend.
The CMF was at +0.1 to underline significant capital inflows to the market. Finally, the Directional Movement Index revealed a strong uptrend in progress with the +DI (green) and the ADX (yellow) both above the 20-mark.
Disclaimer: The information presented does not constitute financial, investment, trading, or other types of advice and is solely the writer’s opinion


