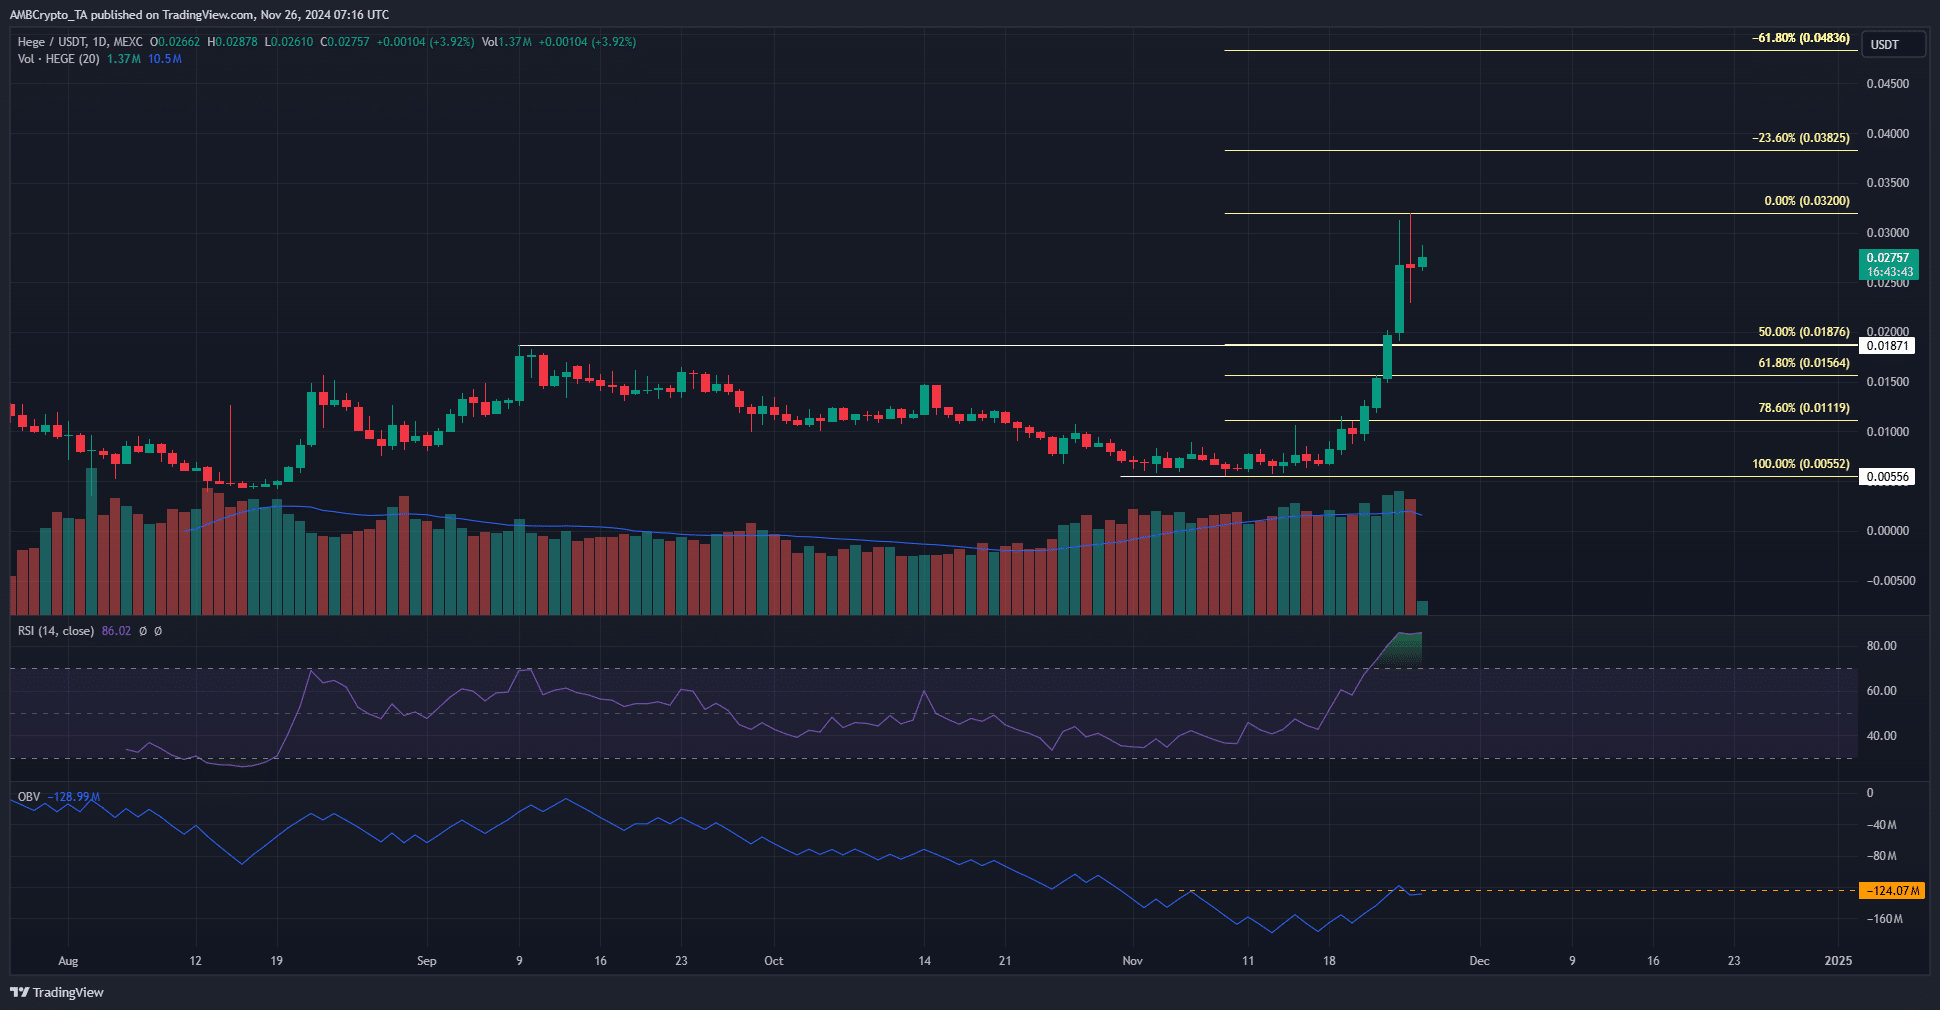
- HEGE can retrace toward $0.02 due to the bearish momentum divergence on the lower timeframes
- The lack of a strong OBV movement meant demand was weak
Hege [HEGE] had a strong bullish trend over the past week. Since the 19th of November, the memecoin was up by 234% until press time. Technical analysis suggested that a price dip toward $0.02 was brewing.
Hege rallies past psychological $0.025
The daily chart showed that a strong bullish structure has taken hold. The first sign of a trend change came on the 19th of November, when Hege tested the $0.0107 resistance zone.
This resistance had been in play since the 27th of October.
The trading volume has slowly picked up steam over the past three weeks. It has been above the 20-period moving average for almost the entirety of November.
Yet, the OBV showed that it was barely able to climb past a local high.
Like the price, the OBV had also been in a downtrend since September. But unlike the price, the OBV was unable to establish a clear uptrend.
This was worrisome because it showed that the remarkable gains that HEGE posted recently were not backed by genuine demand.
Realistic or not, here’s HEGE’s market cap in BTC’s terms
The daily RSI was at 86 to show strong bullish momentum. A bearish divergence has not yet appeared in this timeframe. The lower timeframes such as the 4-hour have developed a bearish divergence.
The next support level was the 50% Fibonacci retracement level at $0.0187. The $0.0208-$0.0236 region was also a short-term demand zone.
Disclaimer: The information presented does not constitute financial, investment, trading, or other types of advice and is solely the writer’s opinion


