- Fantom’s MVRV ratio has increased to 1.59, its highest level in over three months.
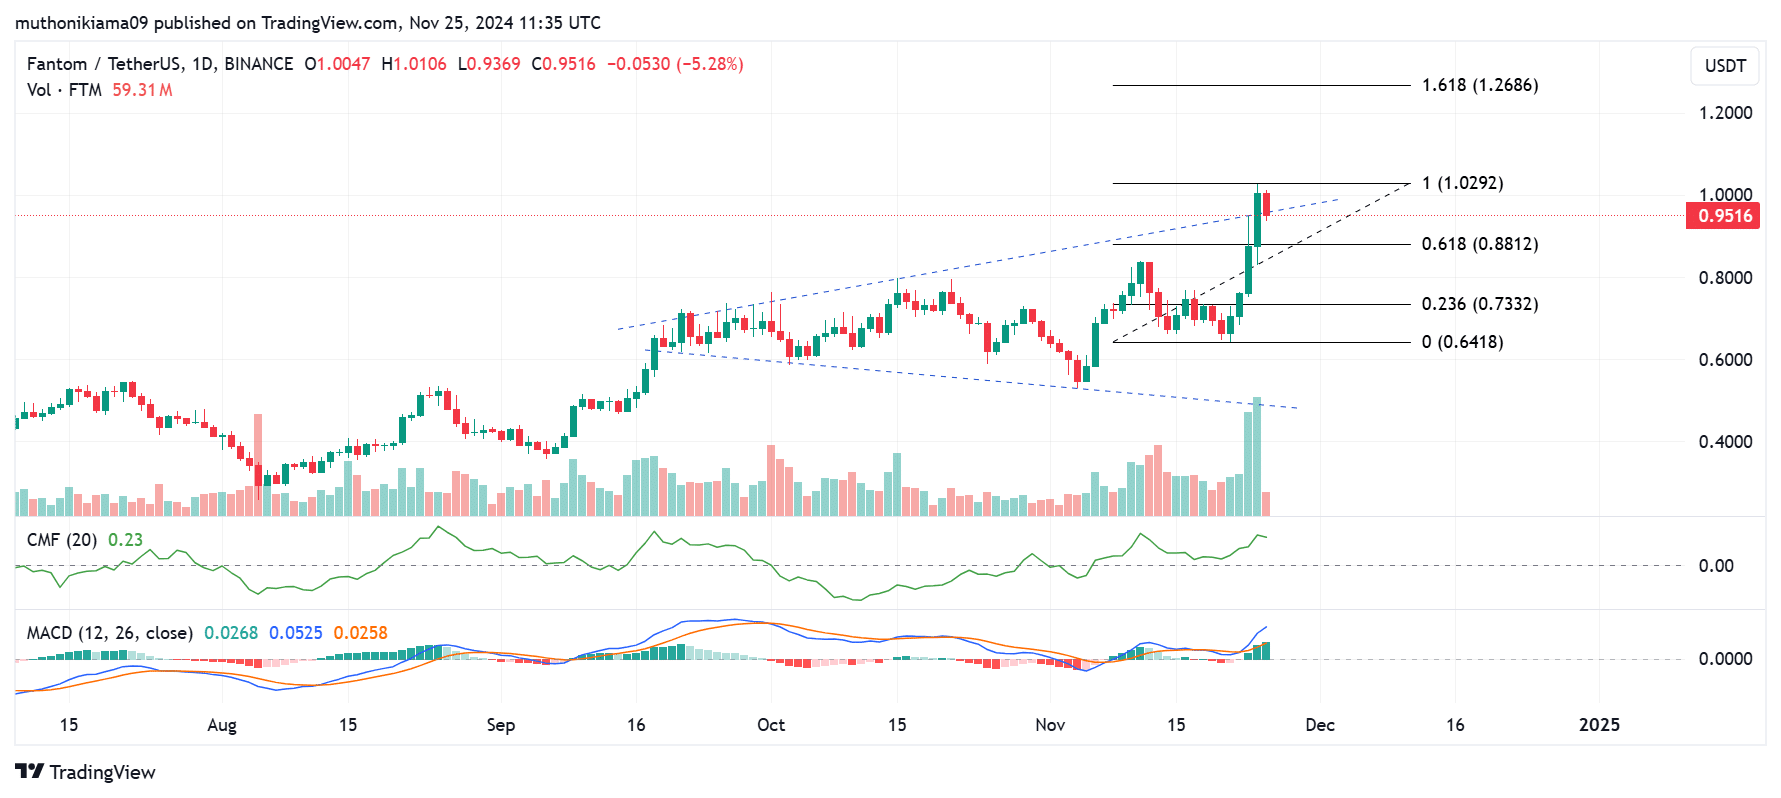
- FTM has also broken out of a broadening wedge pattern on its one-day chart, suggesting further gains
Fantom [FTM], at press time, traded at $0.957 after gaining by 8% in 24 hours. Trading volumes had also surged by more than 30%, per CoinMarketCap.
FTM has been among the top-performing altcoins in November, with month-to-date gains of 48%. These gains have caused a surge in the token’s Market Value to Realized Value (MVRV) ratio.
Data from IntoTheBlock presented a gradual rise in Fantom’s MVRV ratio to a 3-month high of 1.59. This data showed that the average FTM holder was sitting at a profit of 59%.
A rising MVRV ratio shows that FTM holders are increasingly becoming profitable. Moreover, this metric is yet to hit overvalued levels, suggesting there is room for growth.
Traders should watch out for a surge in the MVRV ratio above 2. Such a gain could suggest that FTM is becoming overvalued, causing a trend reversal.
Wallets in profit surge 8% in 7 days
The rising profitability among Fantom wallets can further be seen in the In/Out of the Money metric. In the last seven days, the percentage of profitable wallets has increased from 50% to 58%.
At the same time, the wallets that are in losses have dropped from 46% to 39%. Profitability among investors further indicates bullish sentiment.
Meanwhile, over 22M FTM tokens were purchased by 4,580 addresses when the price was between $0.98 and $1.24.
These wallets might create resistance to FTM’s uptrend, as a surge to these levels could accelerate profit-taking.
FTM breaks out of a broadening wedge pattern
Fantom, on its one-day chart, had broken out of a broadening wedge pattern. The breakout was accompanied by a surge in trading volumes as seen in the green histogram bars, an indication that the uptrend could continue.
The bullish momentum is further seen in Moving Average Convergence Divergence (MACD). At the same time, the Chaikin Money Flow (CMF), with a positive value of 0.23 shows that buyers are in control.
If Fantom continues the uptrend as these bullish signs align, the next target could be the 1.618 Fibonacci level ($1.268). As such, buying activity and positive market sentiment could ignite another 33% rally.
However, on the derivatives market, traders appear to be taking short positions on Fantom.
Read Fantom’s [FTM] Price Prediction 2024–2025
In fact, the Long/Short Ratio, which has been on an upward trajectory over the past week, dropped from 0.97 to 0.92 at press time.
A drop in this ratio shows that derivative traders are betting against Fantom by opening leveraged short positions.


