- AVAX hovers at $34.05 with $875 million in 24-hour trading volume.
- Large transactions hit 542 in 24 hours, while 59.5% of AVAX holders remain profitable.
Avalanche [AVAX] was trading at $34.05 at press time, marking a 0.54% increase over the past 24 hours and a 1.52% gain over the past seven days. Its 24-hour trading volume stands at $87.5 million, reflecting steady market interest.
The past week saw AVAX prices fluctuate within a range of $31.00 to $37.01. Over the last 24 hours, prices have moved between $32.54 and $35.62.
Despite some price volatility, the token has remained in a narrow trading range, suggesting that traders are closely watching key support and resistance levels for directional cues.
Key levels and technical indicators signal range-bound movement
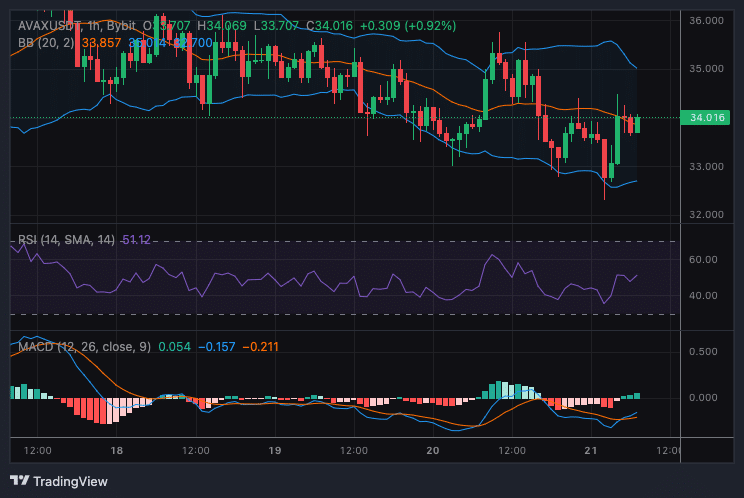
On the 1-hour chart, AVAX has rebounded from the lower Bollinger Band near $33.00, which is a crucial support level. Prices are hovering below the upper Bollinger Band at $34.85, which serves as immediate resistance.
A breakout above this level could pave the way for further gains toward $35.50 or even $36.00.
Momentum indicators provide mixed signals. The Relative Strength Index (RSI) stands at 54, pointing to neutral to mild bullish conditions.
Additionally, the Moving Average Convergence Divergence (MACD) indicator has turned positive, with a recent bullish crossover suggesting a potential continuation of upward momentum.
However, the strength of this movement remains limited, indicating that a breakout above $34.85 is needed for clearer bullish confirmation.
Profitability metrics indicate selling pressure at higher levels
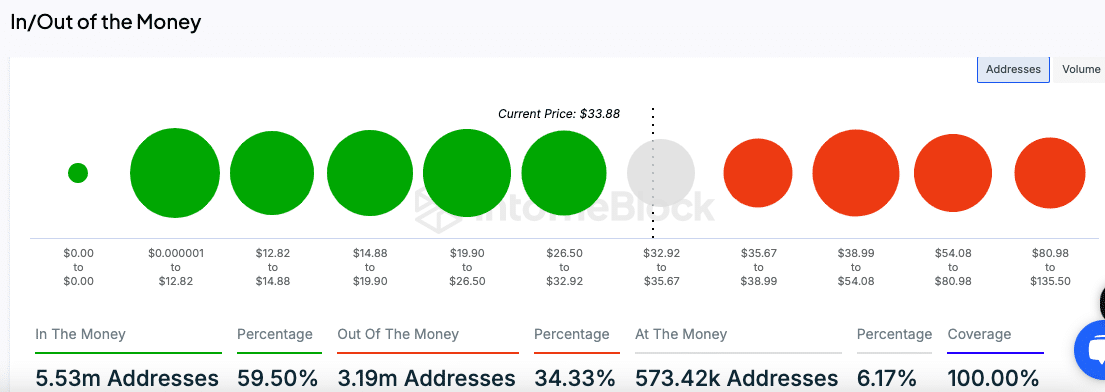
According to the “In/Out of the Money” chart, 59.5% of AVAX holders are currently profitable, with their average acquisition costs concentrated between $19.90 and $26.50.
This profitability zone may create selling pressure as these holders could look to realize gains as prices climb.
On the other hand, 34.33% of holders are at a loss, primarily in the price range between $35.67 and $38.99. These levels represent potential resistance zones as holders may sell to break even.
Meanwhile, 6.17% of addresses are “At the Money,” which reflects a narrow trading range aligning closely with the current price and suggests ongoing consolidation.
Read Avalanche Price Prediction 2024–2025
Large transaction data reflects moderate activity
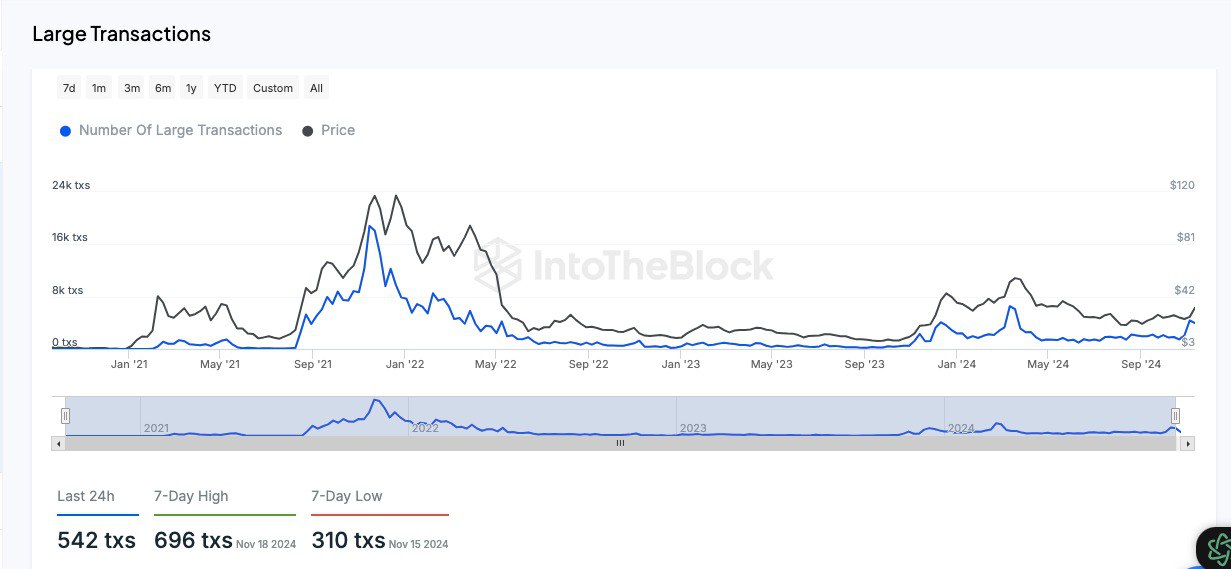
Data from IntoTheBlock shows that 542 large transactions were recorded in the past 24 hours, a decrease from the 7-day high of 696. While this reflects moderate activity, an uptick in large transactions could indicate renewed interest from larger market participants.
Large transactions, often tied to institutional or whale activity, are currently at subdued levels compared to historical peaks.


