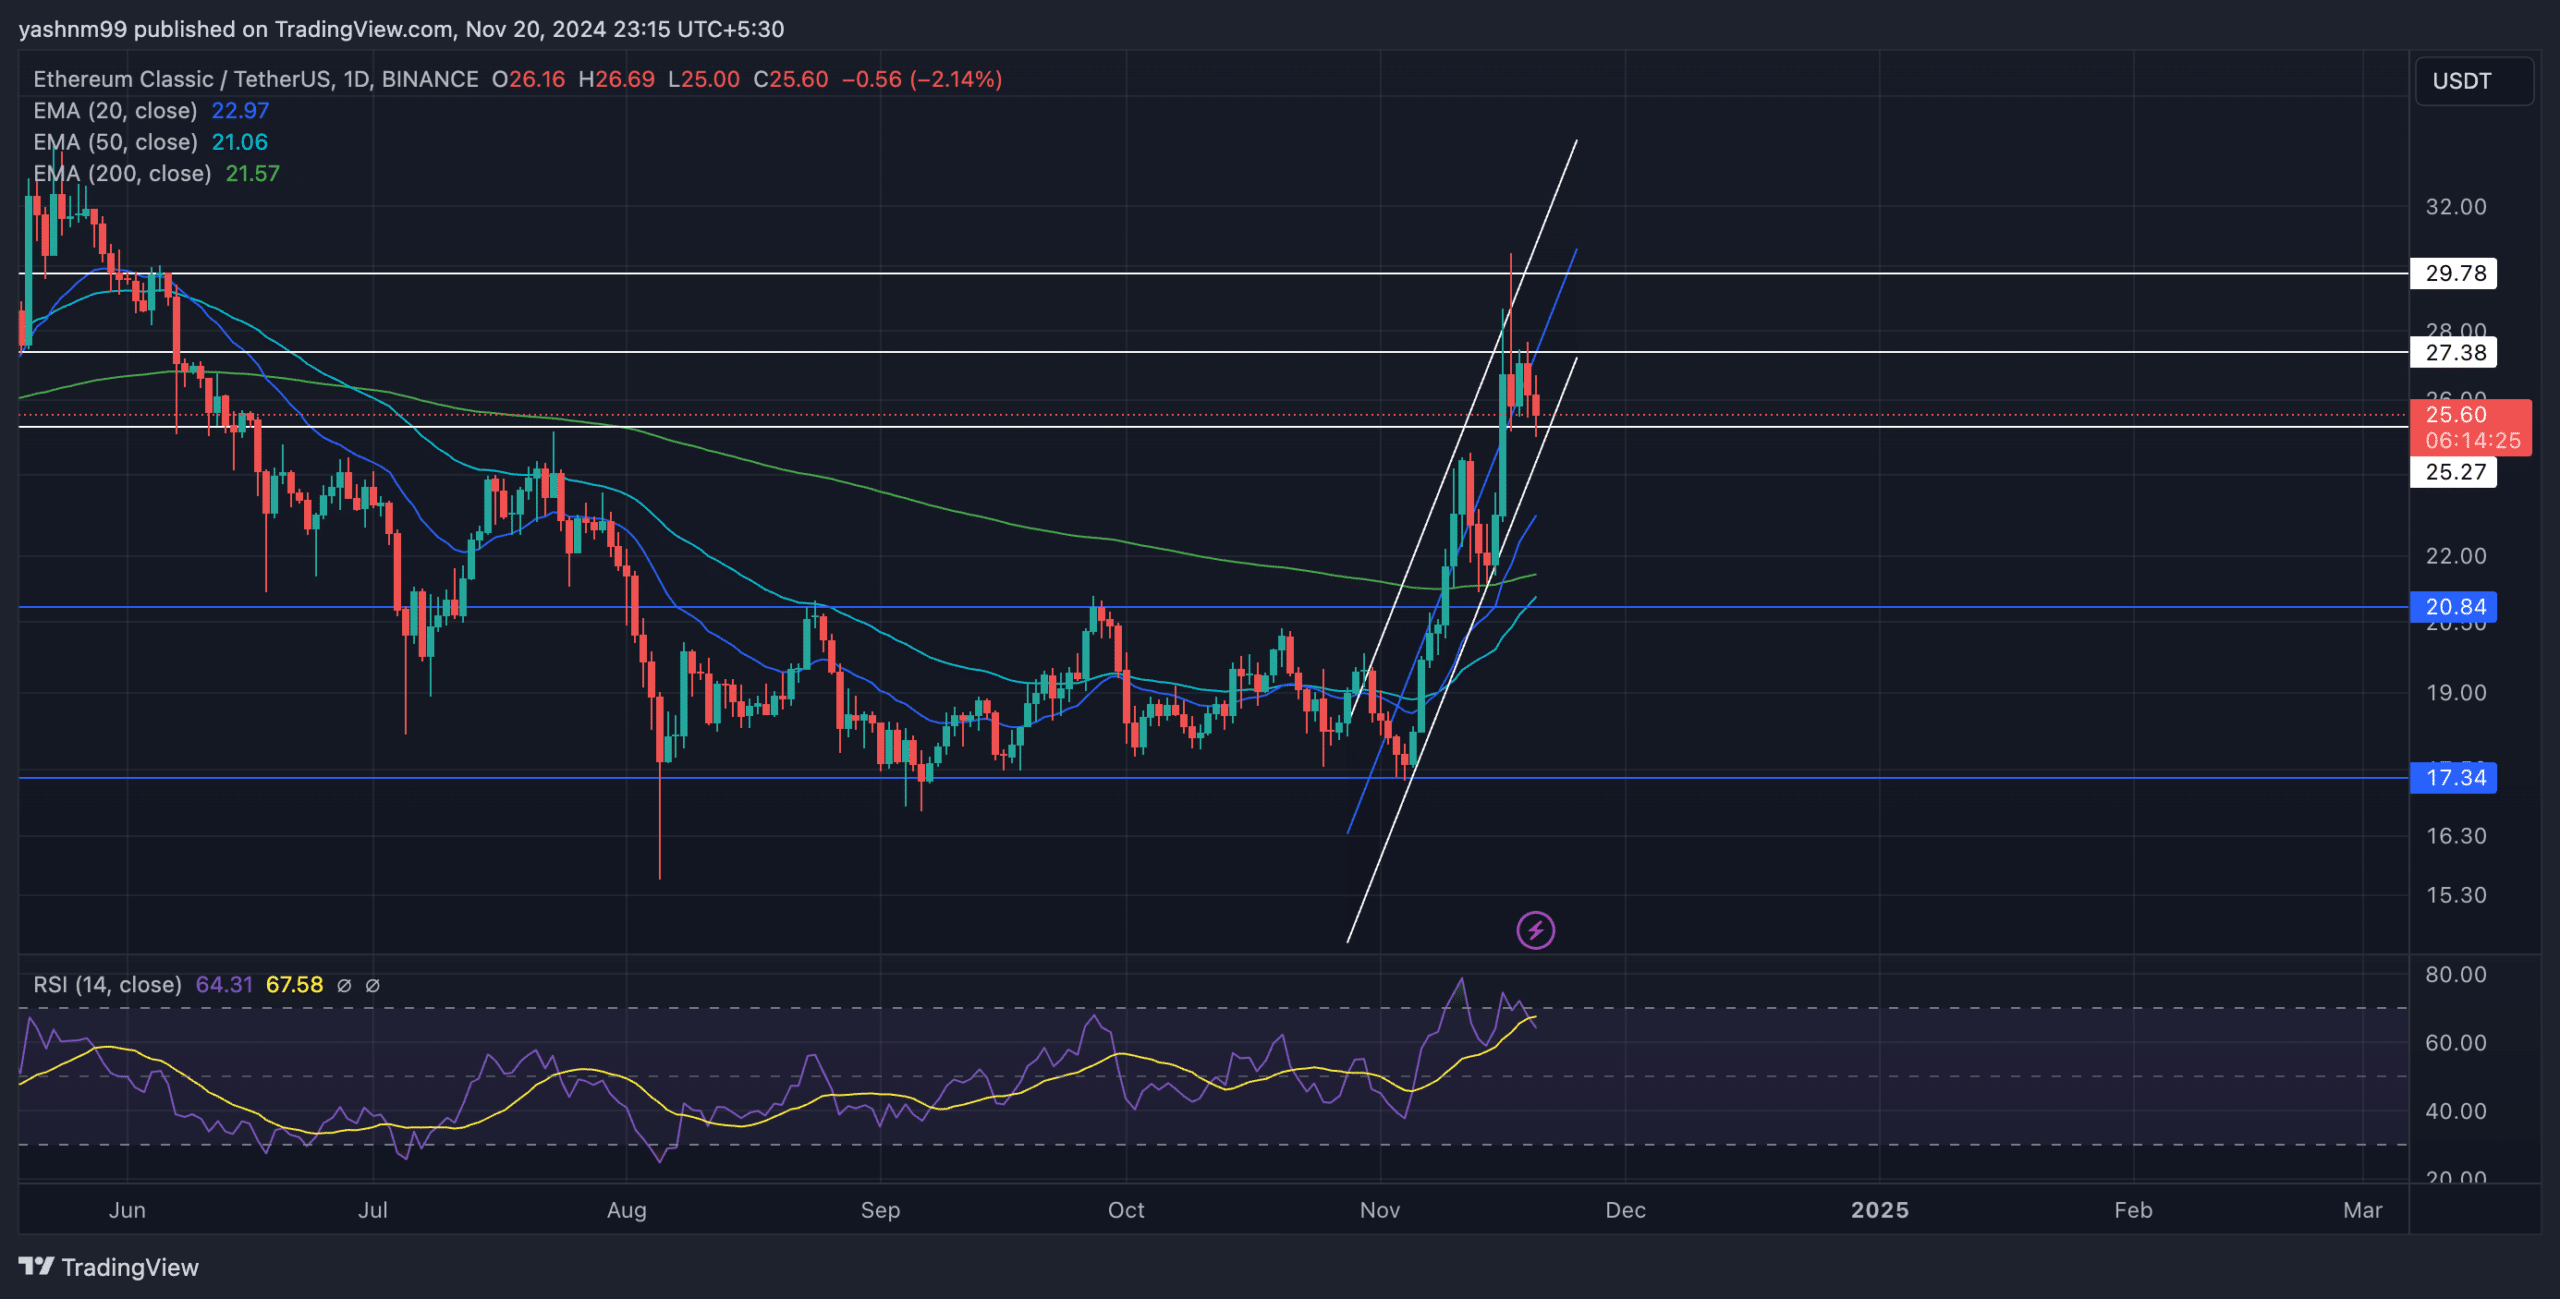
- Given the golden cross on EMAs and ascending channel pattern, Ethereum Classic’s medium-term prospects look promising.
- Derivates data showed a slight edge for bulls, but buyers should closely track BTC’s movement.
Amid the recent Bitcoin bull run, Ethereum Classic [ETC] saw a steep rise and touched its 6-month high on 17th November. However, despite the ongoing gains, ETC struggled to break past the $27 barrier after testing it multiple times over the past few days.
Recent price action and EMA overview
ETC was in an ascending channel pattern on the daily chart, which has historically been a reversal pattern in the near term. The altcoin marked a series of higher lows and higher highs, contributing to its upward trajectory over the last few weeks.
The altcoin was trading at around $25.46 at press time, down 2.68% in the last 24 hours. The 20-day EMA ($22.95) crossed above both the 50-day EMA ($21.05) and the 200-day EMA ($21.57), indicating strong bullish momentum.
However, the $27.38 and $29.78 levels continued to offer stiff resistance for buyers.
Should the current upward channel hold, ETC could retest the upper boundary, near the $29-$30 range. On the flip side, if bears pull the price below the lower trendline, immediate support could lie around the near-term EMAs at around $23.
The RSI stood at around 64, indicating slightly overbought conditions. A potential decline from these levels could lead to a short-term correction towards the 50-mark, reaffirming more balanced market dynamics. Buyers must watch for a possible dip in RSI to gauge the chances of a correction.
ETC’s Derivatives revealed THIS
The Open Interest across all exchanges was down by 4.56% to $148.63 million. Similarly, trading volume decreased by 14.03% to $338 million, reflecting reduced market activity.
Interestingly, the 24-hour Long/Short ratio was 0.8577 and showed a bearish bias. However, Binance and OKX had more optimistic ratios of 2.11 and 2.7, respectively, suggesting positive sentiment among traders on these platforms.
The recent surge in Open Interest among top traders on Binance showed a bullish bias, with a Long/Short ratio of 2.1 for accounts and 1.2 for positions. This indicated that leading traders were still positioning for upward momentum.
Read Ethereum Classic’s [ETC] Price Prediction 2024–2025
However, BTC’s recent movements could play a crucial role in shaping ETC’s short-term action, especially as BTC reaches overbought conditions.
If Bitcoin’s bullish momentum continues, ETC could breach the $27 resistance and aim for the $30 zone. Alternatively, any slowdown in BTC’s momentum could see ETC pull back towards the $21-$22 range.


