- TRX recorded gains of over 26.17% in the last 30 days
- TRON’s USDT weekly volume surpassed 150 billion – A sign of strong adoption
TRON, at the time of writing, was valued at $0.1986 with a market capitalization surpassing $17 billion. In the last 7 days alone, the altcoin surged by 12.13% on the charts – An indication of strong investor confidence and bullish market sentiment.
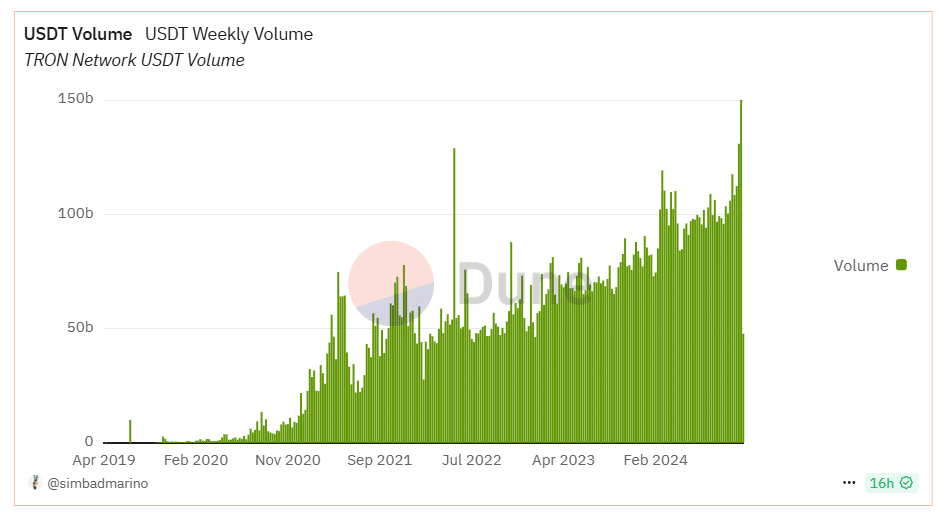
That’s not all though. Outside of the price front, TRON’s network noted a remarkable rise in USDT (Tether) transaction volumes since 2019, with a sharp uptick in recent months.
In fact, weekly USDT volumes have now surpassed 150 billion – Underscoring TRON’s growing adoption as a preferred platform for stablecoin transactions.
TRON’s dominance can be further amplified by USDT’s position as the market’s leading stablecoin, representing approximately 70% of the total stablecoin market cap. Figures for the same stood at $184.02 billion, at press time.
The aforementioned hike has been driven by TRON’s efficient transaction processing, low fees, and ability to facilitate high-volume transfers. These factors have made it an attractive option for users seeking affordability and speed.
With TRON contributing $61.7 billion of USDT’s market cap through massive transaction activity, it has cemented itself as a critical enabler in the stablecoin ecosystem.
Despite USDC being favored by regulators, USDT has outpaced competitors with a 7.64% rise in market cap, a 31.55% hike in monthly transfer volume ($1.95 trillion), and a 7.99% uptick in active addresses (22.09 million) over the last 30 days.
TVL’s recovery marks a robust year for TRON
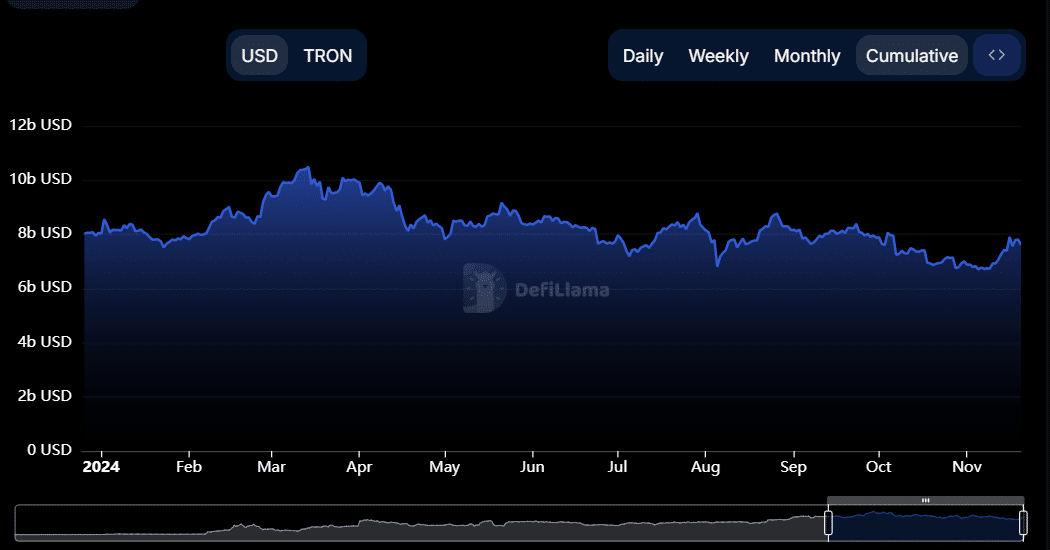
TRON’s Total Value Locked (TVL) has also recovered significantly since early November. Figures for the same picked up momentum toward the end of last month after a two-month decline from September.
This rebound can be interpreted to be a sign of renewed interest and confidence in TRON’s ecosystem as market conditions stabilize.
Initially starting the year at around $8 billion, TRON’s TVL peaked at $10 billion in April, followed by mid-year fluctuations.
Despite a dip through September and October, November’s recovery highlighted TRON’s ability to bounce back. At the time of writing, the TVL had stabilized near $7 billion.
Stochastic RSI points to a price rebound
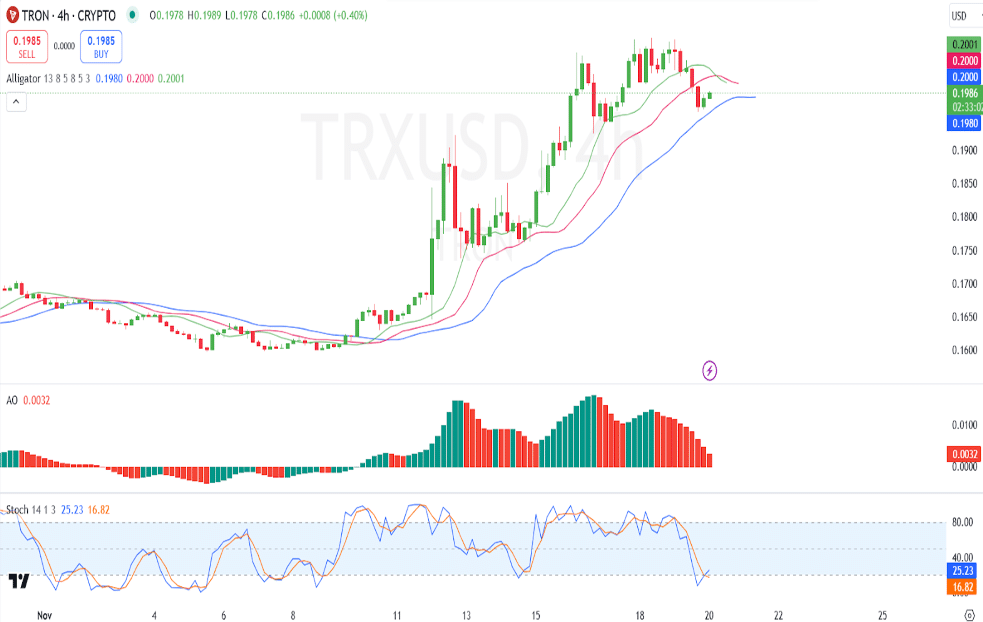
On the price charts, TRX seemed to be consolidating around $0.1986, with $0.1930 acting as a critical support level. A break below this level could signal the onset of a short-term bearish trend.
Conversely, if the price breaks above $0.2070, it may pave the way for a rally towards the $0.2200 resistance zone.
The Alligator lines were converging too, indicating reduced market momentum and potential consolidation. Traders should watch for a crossover to confirm a possible trend reversal. The AO underlined declining bullish momentum with red bars making their appearance – A sign of weakening buying pressure. A continuation below the zero line could confirm short-term bearish momentum.
Finally, the Stochastic RSI was in the oversold zone with a reading of 25.23. It also pointed to the possibility of a potential price reversal.
A bullish crossover here could trigger a recovery rally.


