- Analyst Michaël van de Poppe sees Optimism surging by 60% after clearing its $1.83 resistance.
- On-chain data shows 84% of OP supply held by whales, signaling strong accumulation ahead of a potential rally.
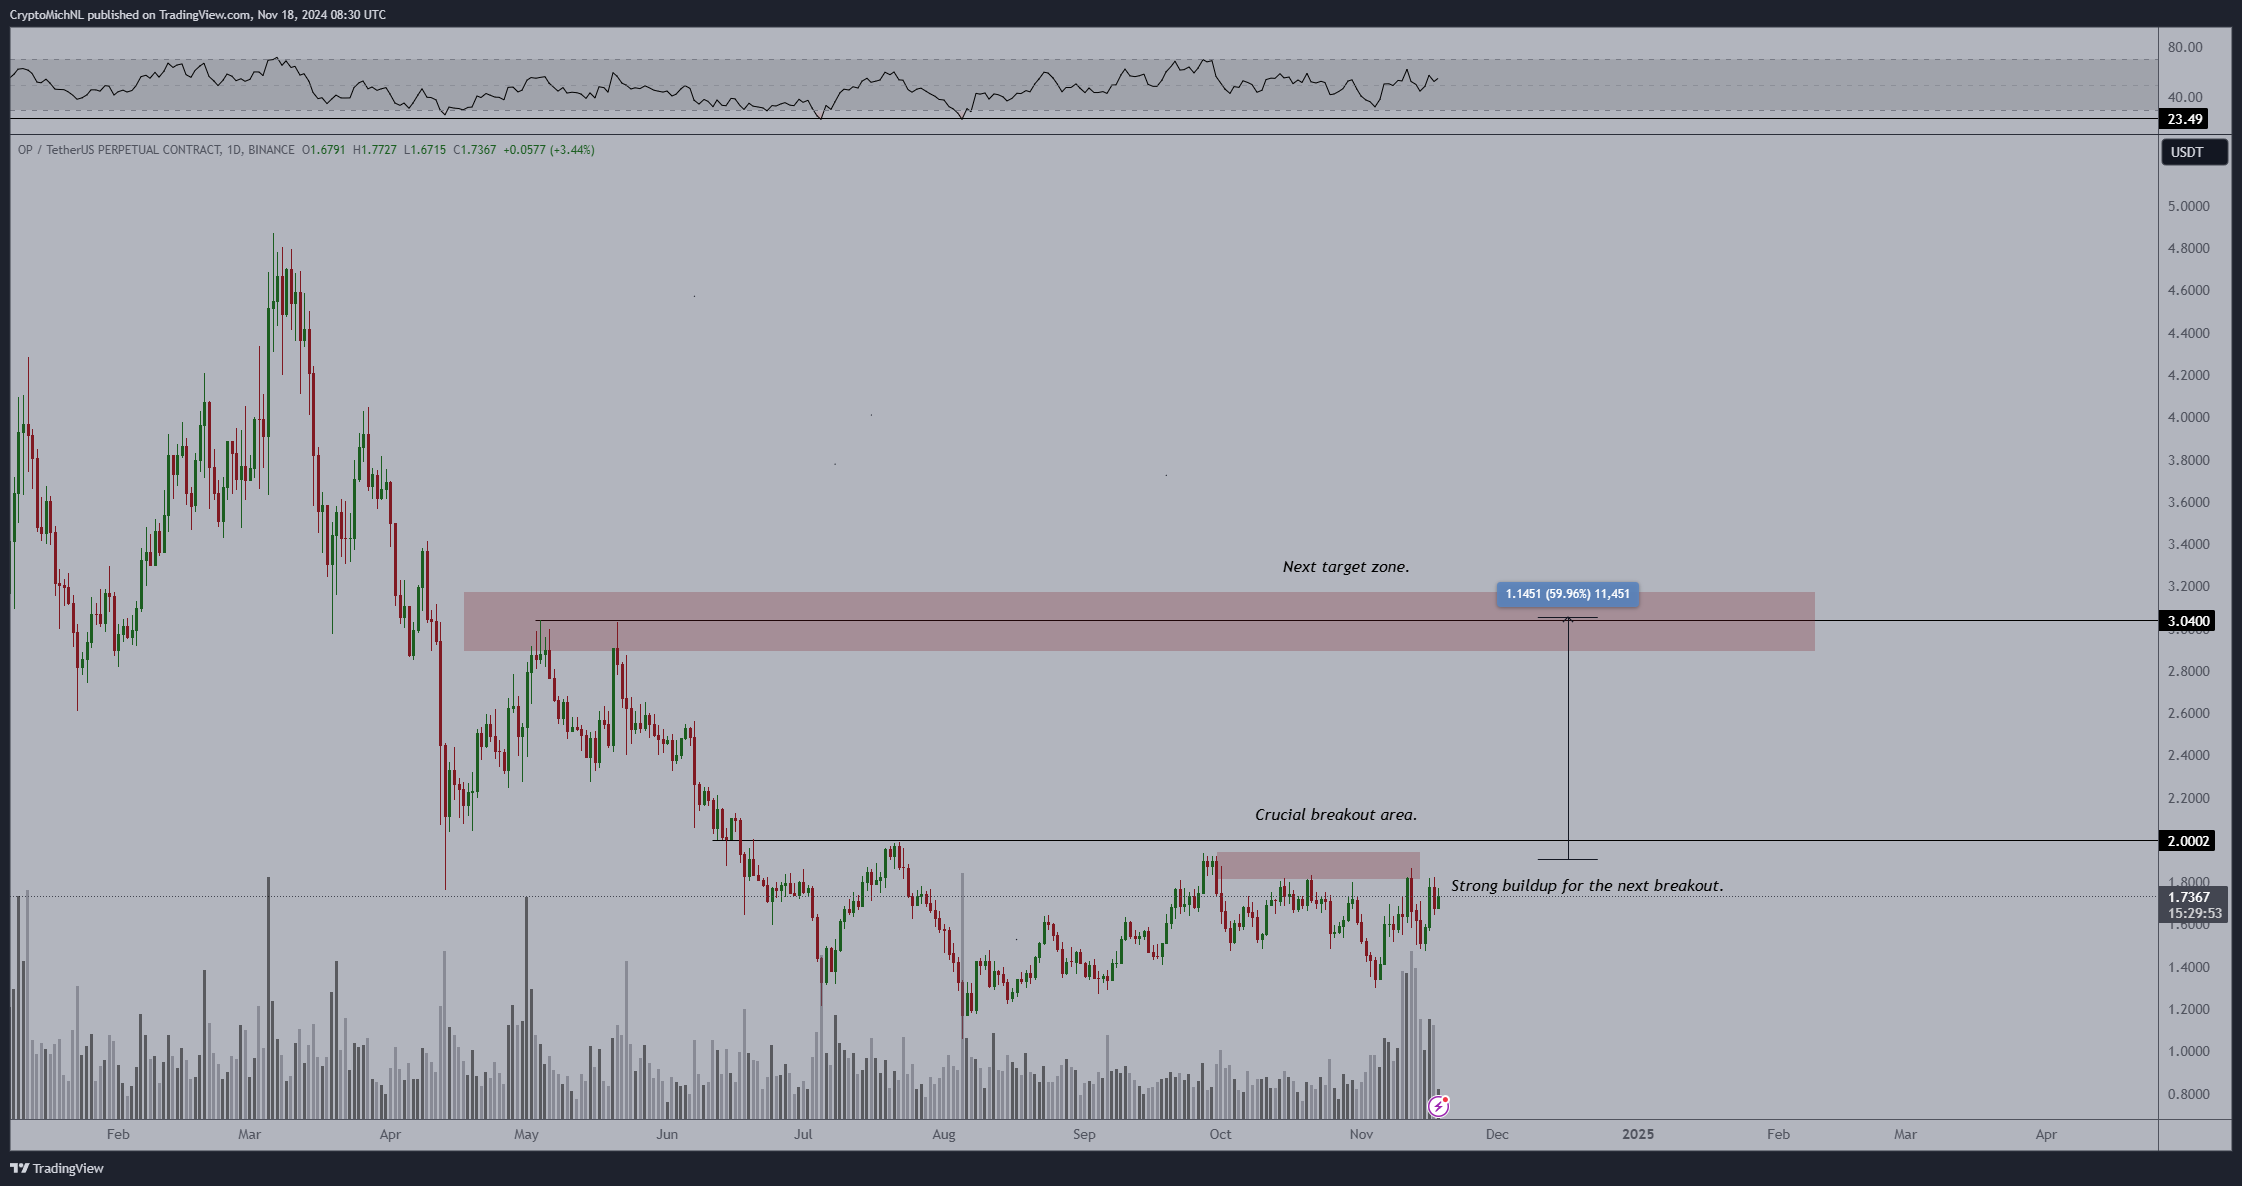
Michaël van de Poppe, a crypto enthusiast, has predicted a potential breakout for Optimism [OP]. According to him, Layer 2 networks like OP are primed for a substantial rally, with the asset potentially surging by 60% once it breaches a critical resistance level.
Van de Poppe highlighted the growing momentum in Layer 2 ecosystems, which are following the lead of Layer 1 projects that have already seen significant gains.
Optimism’s current resistance lies at $1.83, and the price is consolidating just below this level. Van de Poppe suggested that once this resistance is cleared, OP could see a swift upward movement toward higher price targets.
Price action and key levels to watch
Market data shows OP trading at $1.77 at press time, reflecting a 1.35% increase in the last 24 hours. Despite this short-term gain, the asset has seen a 1.30% decline over the past week, as it continues to face challenges breaking past the $1.83 resistance.
Sellers have consistently defended this level, keeping the price in a tight range between $1.70 and $1.83.
Technical analysis points to $1.70 as a key support level that could hold if the price pulls back. On the upside, a breakout above $1.83 could set the stage for a rally toward the next major resistance at $2.00.
Beyond that, some analysts are eyeing a potential target zone between $3.25 and $3.50 if broader market conditions remain favorable.
Technical indicators signal mixed momentum
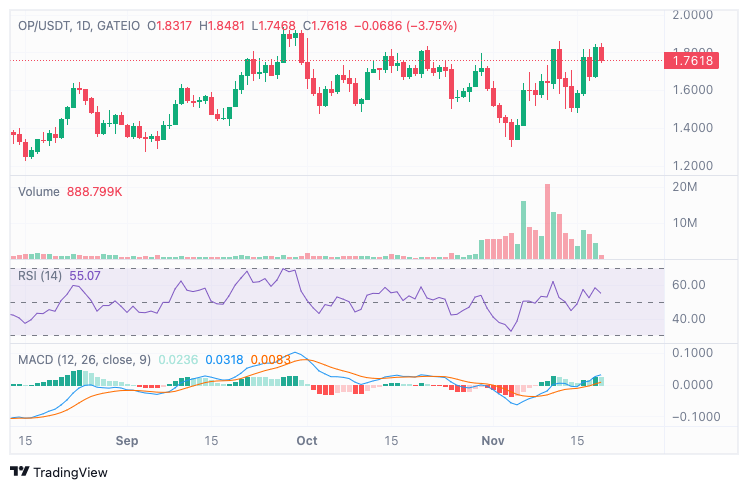
The Relative Strength Index (RSI) for OP currently stands at 55.07, suggesting moderate bullish momentum. This level indicates that the asset is not yet overbought, leaving room for further upward movement.
However, a drop in RSI could signal weakening bullish strength, leading to a possible retest of lower support levels around $1.70.
The Moving Average Convergence Divergence (MACD) indicator provides a more positive outlook, with the MACD line remaining above the signal line.
Positive histogram bars show that buying pressure is still present, although the narrowing histogram suggests momentum might be slowing.
Holder data and market activity
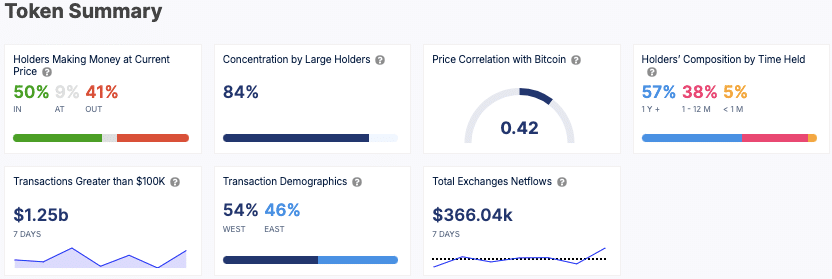
On-chain data reveals that 50% of OP holders are currently in profit, while 41% are at a loss, indicating a balanced distribution of market positions.
The data also shows a high 84% concentration of large holders, suggesting that whales continue to play a significant role in OP’s price movements.
Market activity has been robust, with $1.25 billion in large transactions over the past week. Additionally, net exchange inflows totaled $366,040, indicating increased trading and potential accumulation by market participants.
OP’s correlation with Bitcoin is measured at 0.42, showing some level of dependence on broader market trends.


