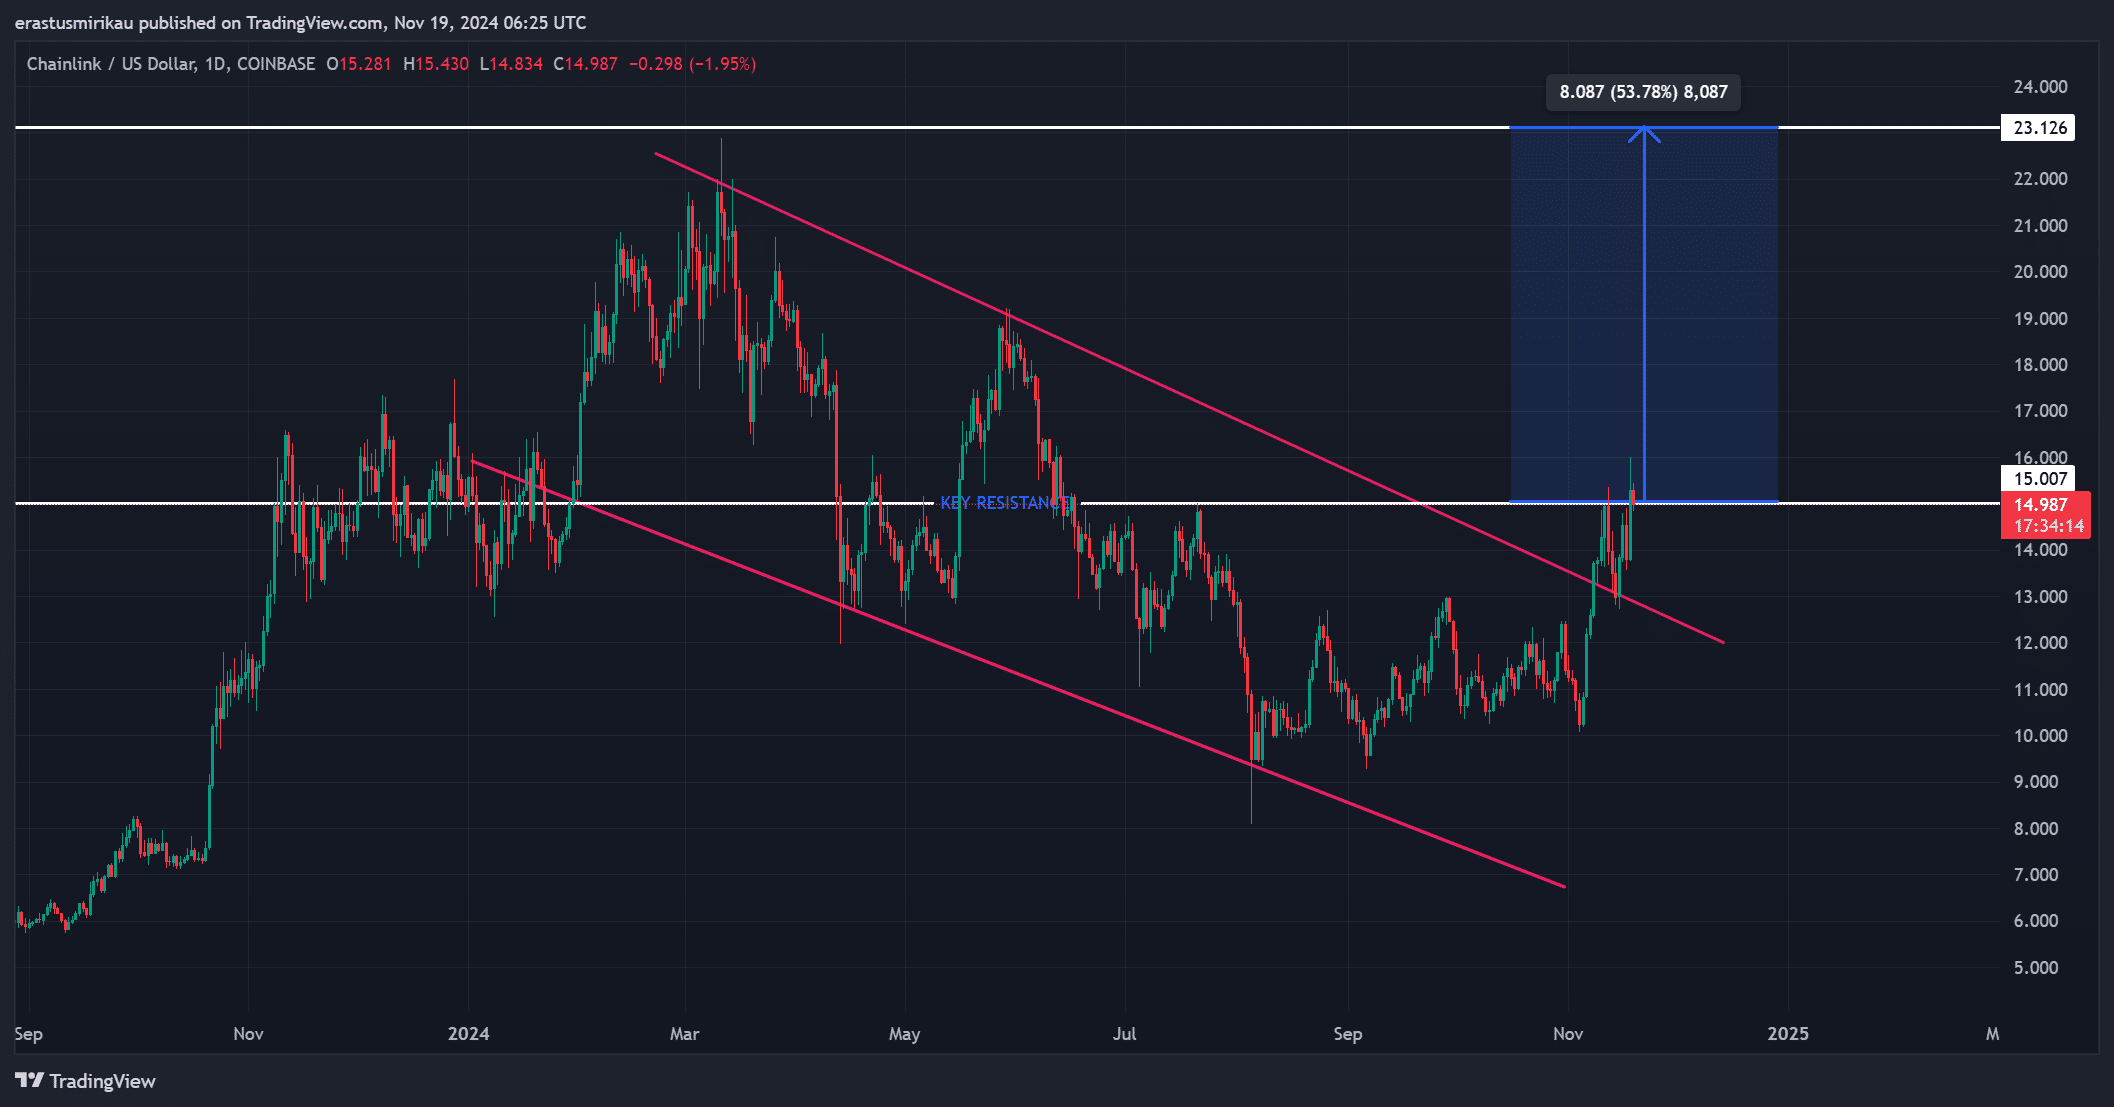
- Chainlink broke out of a descending channel, retested $15 resistance, and targets $23 next.
- On-chain metrics and liquidation data support sustained bullish momentum for $LINK’s rally.
Chainlink [LINK] has decisively broken out of its long-term descending channel, signaling a dramatic shift in momentum. This breakout comes after months of consolidation and bearish pressure, suggesting a potential trend reversal.
At press time, LINK was trading at $14.97, up 2.77% in the last 24 hours, with a market cap of $9.39 billion.
Trading volume has surged by 86.04% to $981.98 million, reflecting increasing market participation. With the price retesting the $15 resistance, $LINK seems poised for a rally toward the $23 target.
LINK retesting key levels with strong bullish momentum
The retest of the $15 resistance level, a crucial price zone, adds further weight to $LINK’s bullish breakout. This level, now acting as a springboard, could propel the token to a 53% upside, targeting the $23 resistance.
Historically, breakouts of this nature have led to extended rallies, and the $15 retest is considered a strong confirmation signal. Consequently, traders are closely watching whether $LINK can consolidate above this level in the coming sessions.
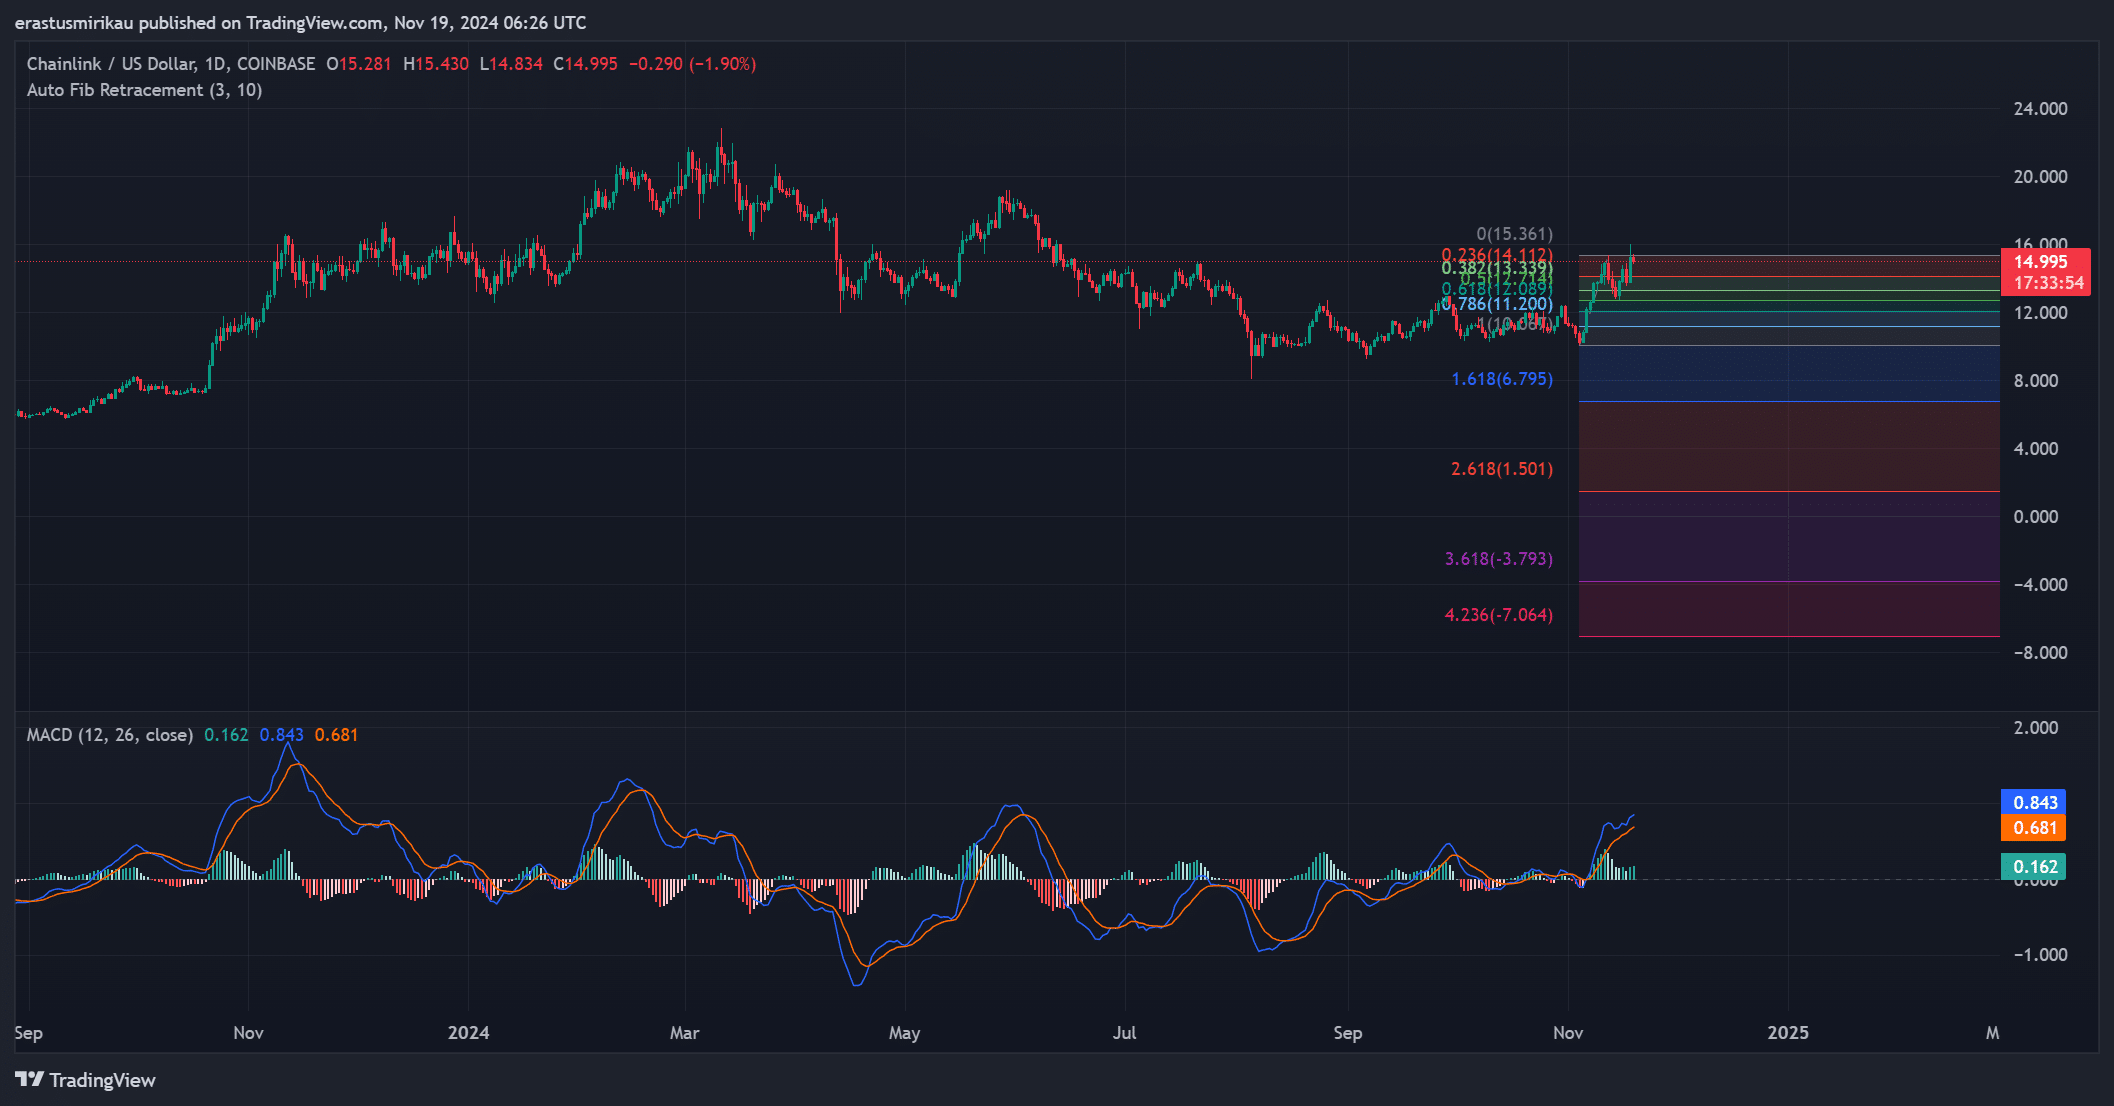
Momentum indicators provide additional bullish signals. The MACD shows a growing divergence between the MACD and signal lines, coupled with a rising histogram of green bars. This suggests that buying pressure is steadily increasing.
Moreover, a Fibonacci retracement from the previous lows to the recent breakout places the $23 level at a critical resistance zone, confirming its importance in the broader price trajectory.
LINK on-chain activity reinforces positive outlook
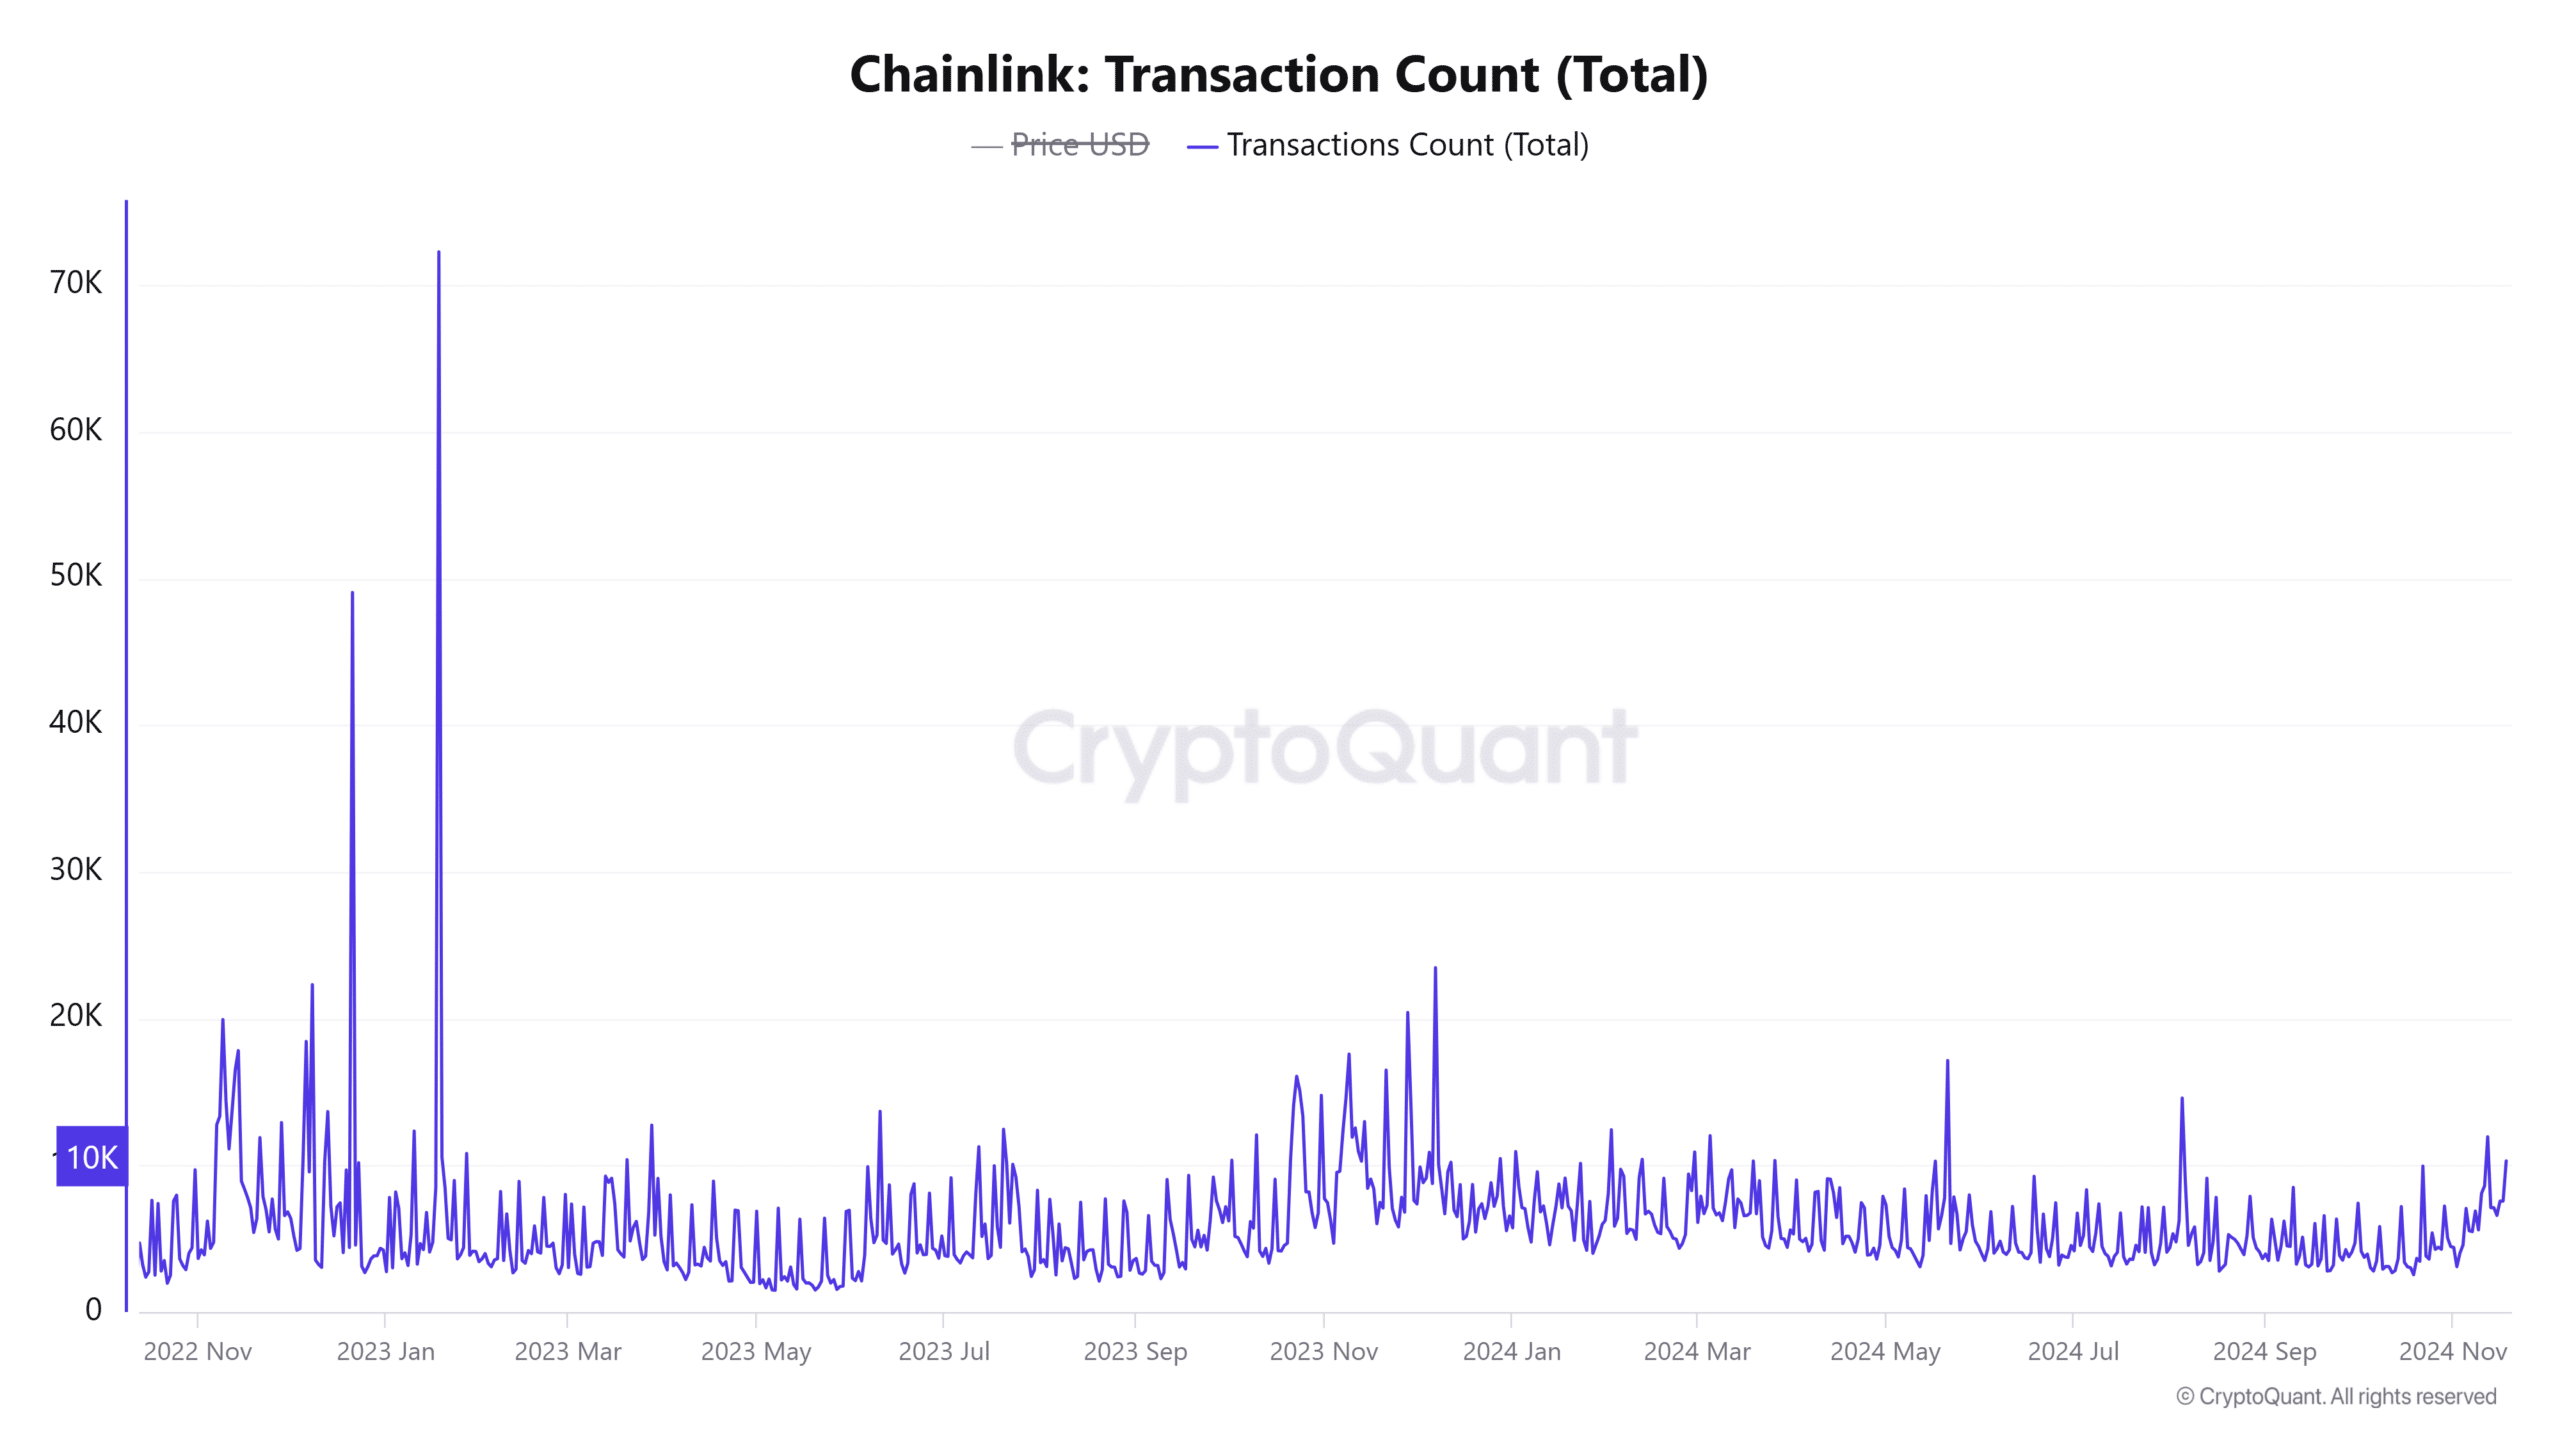
On-chain metrics further support the bullish narrative. The number of active addresses has increased by 1.24% over the last 24 hours, reflecting growing engagement with the Chainlink network.
Additionally, transaction counts have risen by 1.76% to 13,065 in the same period. These increases in activity point to heightened network usage, which often correlates with price increases.
Liquidation data highlights bullish sentiment
Liquidation data indicates that traders are overwhelmingly betting on $LINK’s price increase. Long liquidations totaled $67.61K, significantly higher than short liquidations of $10.63K, showcasing strong market confidence.
This imbalance suggests traders expect further price appreciation, adding another layer of optimism to the current outlook.
Is your portfolio green? Check out the LINK Profit Calculator
Conclusively, Chainlink’s breakout from the descending channel, alongside the successful retest of $15, signals that $LINK is well-positioned to reach the $23 target.
With strong technical indicators, growing on-chain activity, and bullish liquidation data, the rally appears sustainable. Therefore, $LINK is likely to hit $23 in the near term, provided it consolidates above $15.


![Decentralized Science [DeSci] crypto hits $1.3B market cap – AIMX leads](https://hamsterkombert.com/wp-content/uploads/2024/11/Decentralized-Science-DeSci-crypto-hits-13B-market-cap-–-AIMX.webp-150x150.webp)
