- BONK has hiked by over 80% in the last seven days
- At the time of writing, the memecoin was well inside the oversold territory
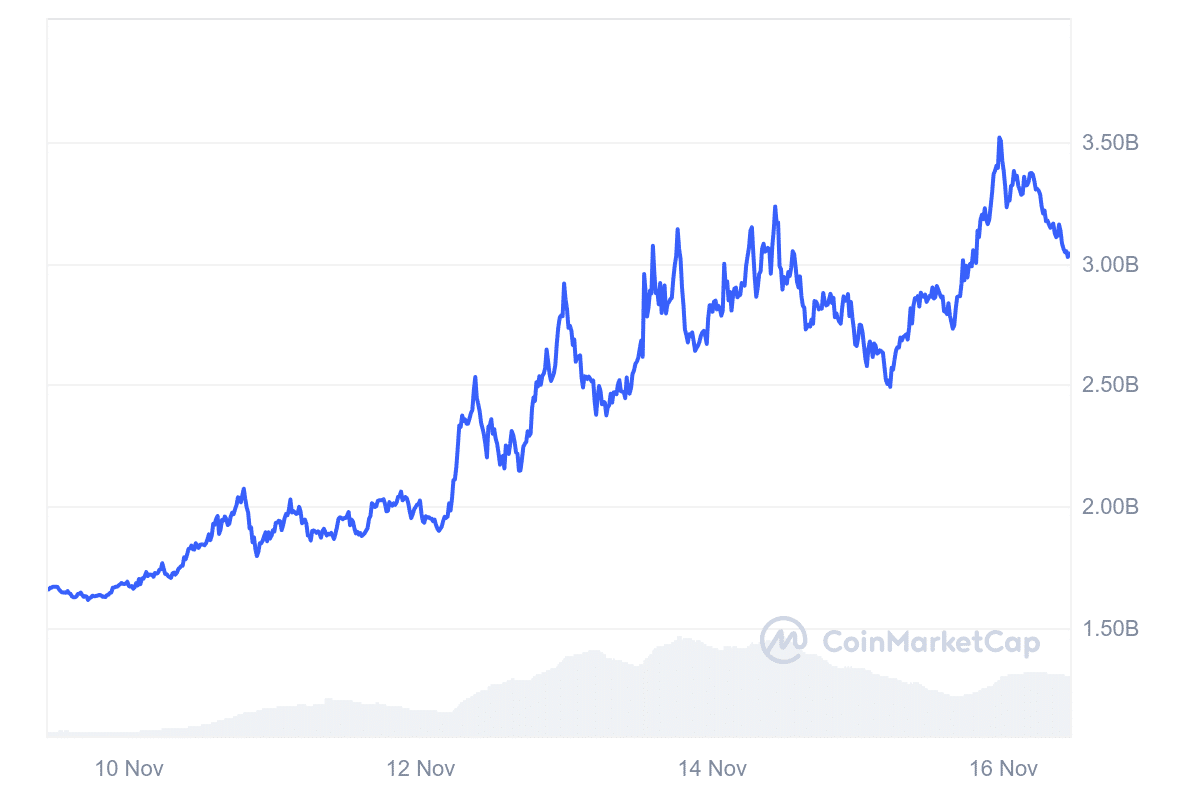
BONK recently crossed the $3 billion market capitalization threshold. This move solidified its position as the second-largest memecoin on the Solana blockchain and the fifth-largest across the wider market.
It’s worth pointing out though that this remarkable hike has been accompanied by a hike in market activity, surging volume, and significant price action.
BONK’s market cap and volume explosion
Over the last 7 days, BONK’s market capitalization has climbed dramatically, peaking above $3 billion before retracing slightly. In fact, CoinMarketCap‘s chart highlighted this sharp ascent too – A sign of growing investor interest.
According to the same, BONK is now second only to dogwifhat (WIF) among Solana-based memecoins, with the same having a market capitalization of over $3.7 billion.
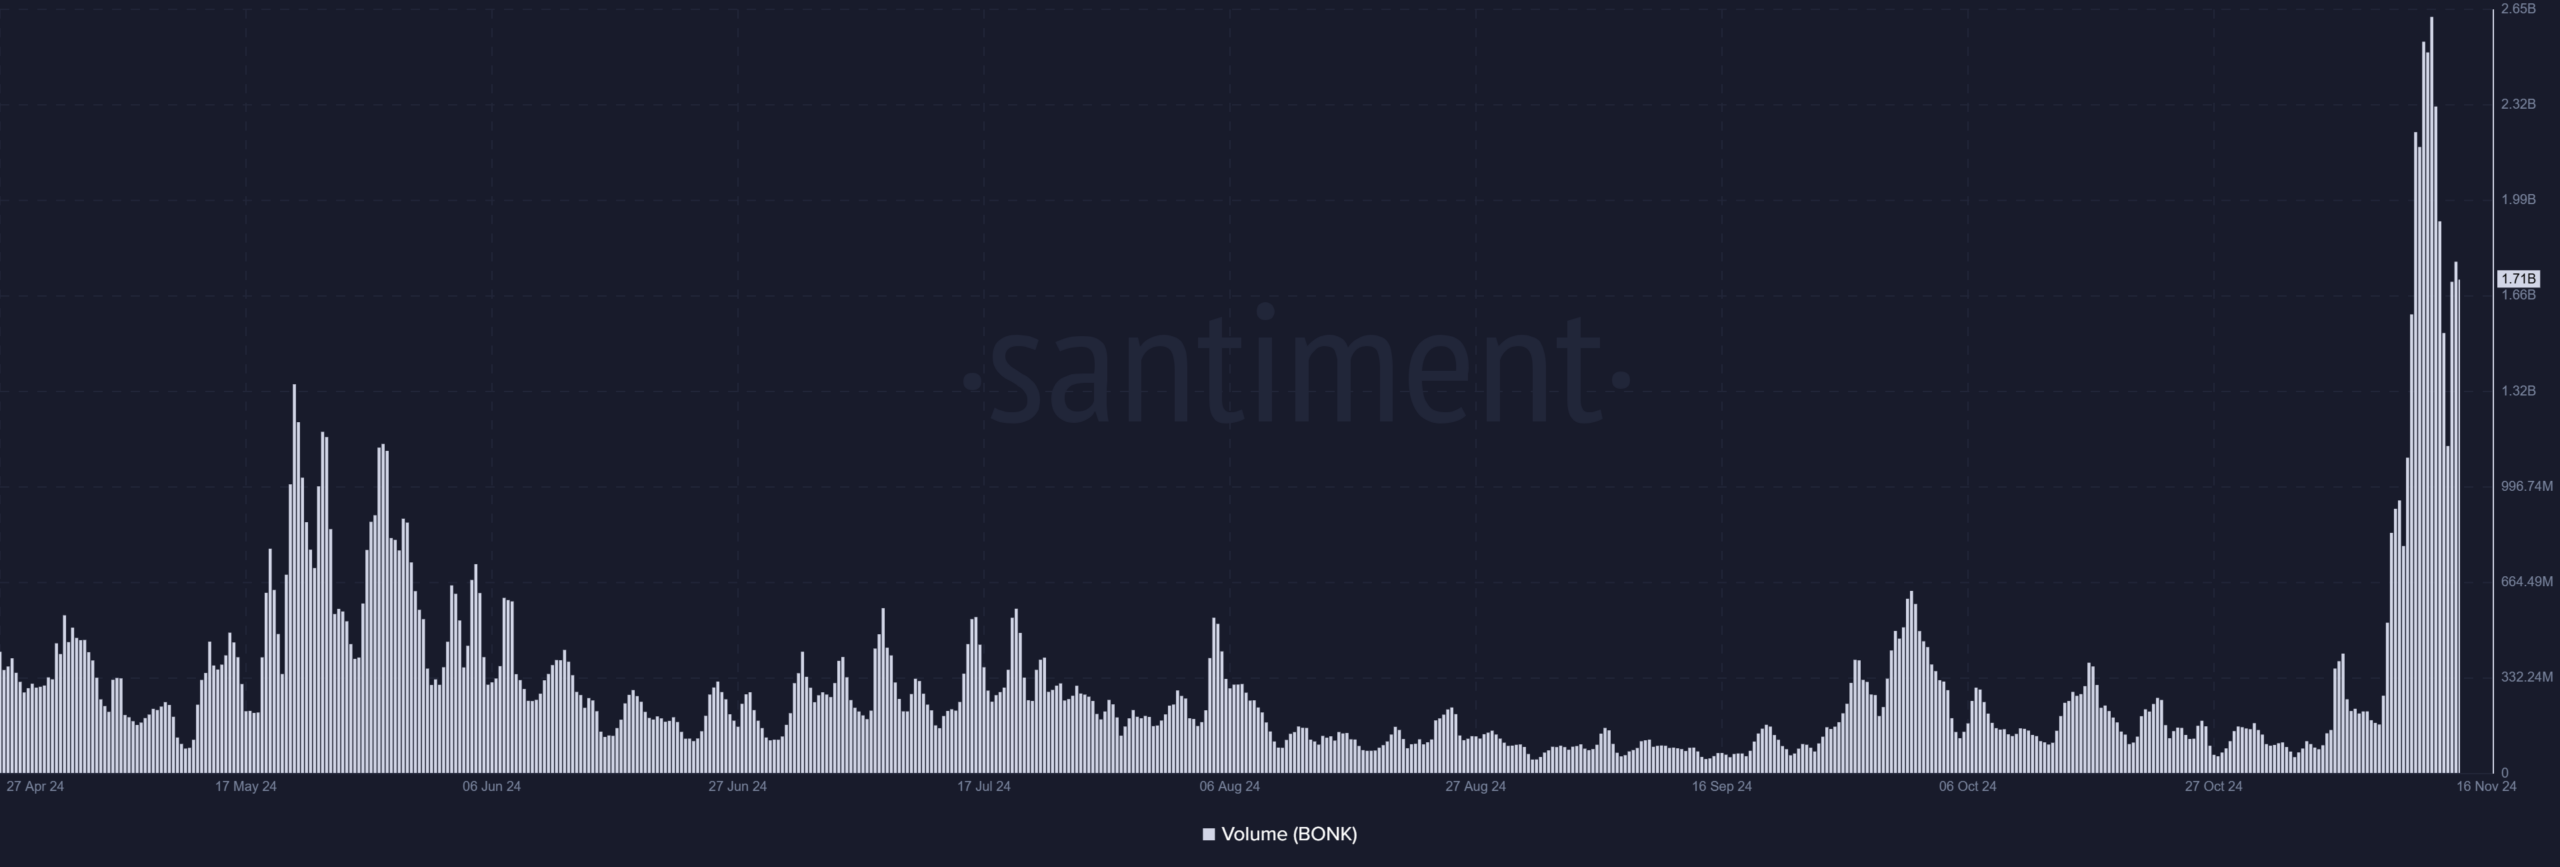
Also, a surge in trading volume, as illustrated by Santiment’s volume chart, confirmed heightened engagement. BONK spiked to over $2.6 billion on 14 November, indicating strong liquidity and greater speculation.
This uptick in activity is not just isolated to BONK alone though. In fact, it has also contributed to positive sentiments for Solana. At the time of writing, the trading volume was almost $1.7 billion.
Key technical indicators signal potential for more gains
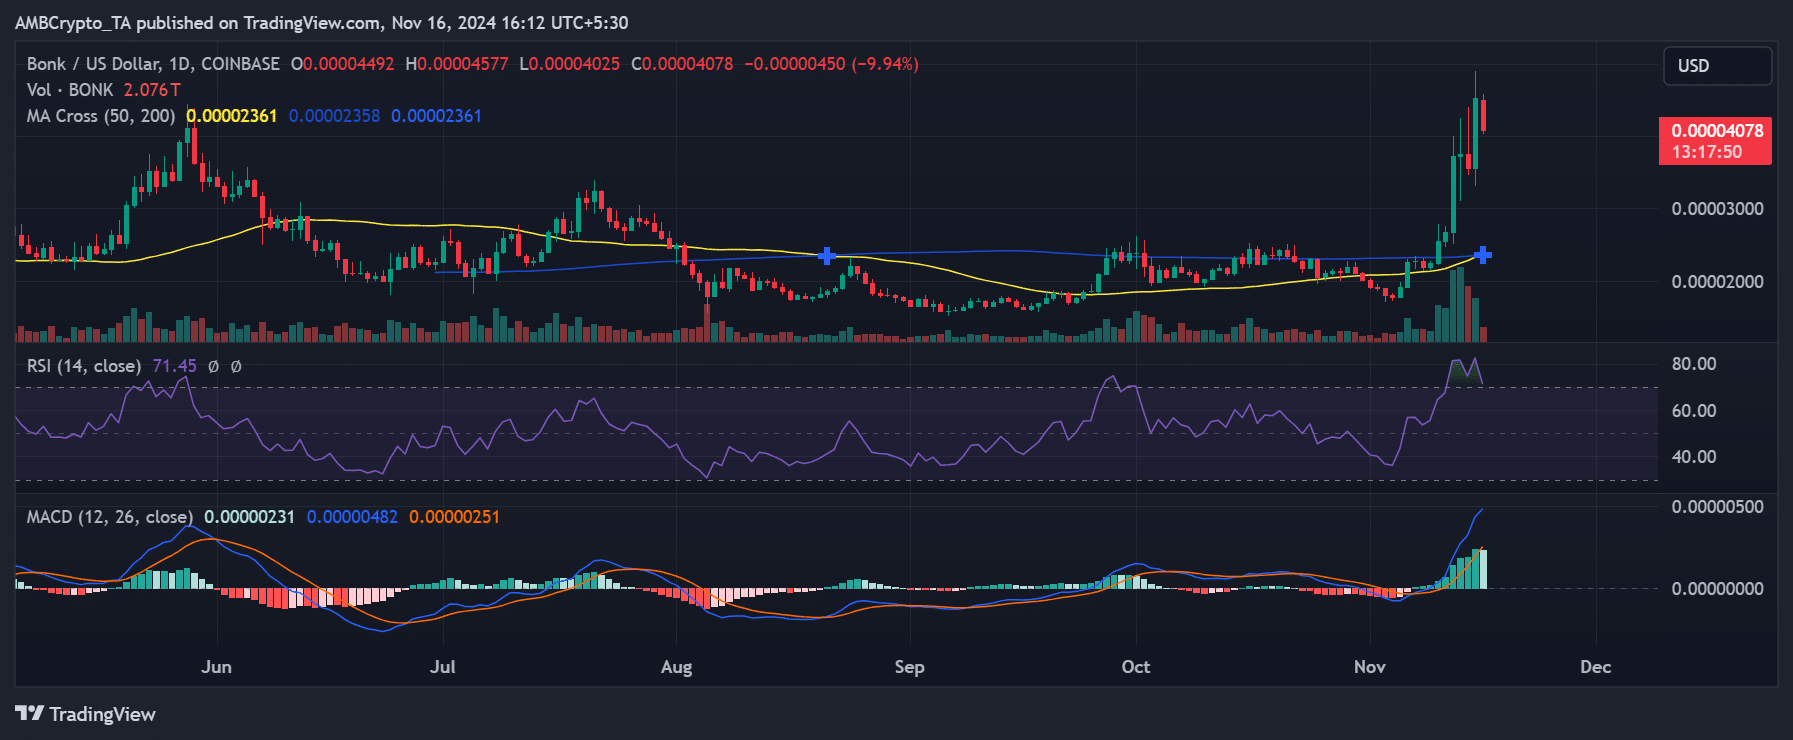
From a technical perspective, BONK seemed to be exhibiting some bullish signs. The daily chart revealed a golden cross forming between the 50-day and 200-day simple moving averages (SMA) – A classic sign of a potential sustained uptrend.
Historically, such formations attract traders seeking confirmation of long-term bullish momentum.
At press time, BONK was trading at $0.00004065, down 10.23% over the last 24 hours. Despite this short-term correction, however, the Relative Strength Index (RSI) at 71.18 remained in overbought territory – A sign of sustained buying interest. The Moving Average Convergence Divergence (MACD) indicator also pointed to bullish momentum, albeit with signs of potential cooling as the rally consolidated on the charts.
Key levels to watch include the immediate support at $0.000035 and resistance around $0.000045 – A break above which could pave the way for further gains. Conversely, a dip below the support level might invite profit-taking.
Correlation with Solana’s price action
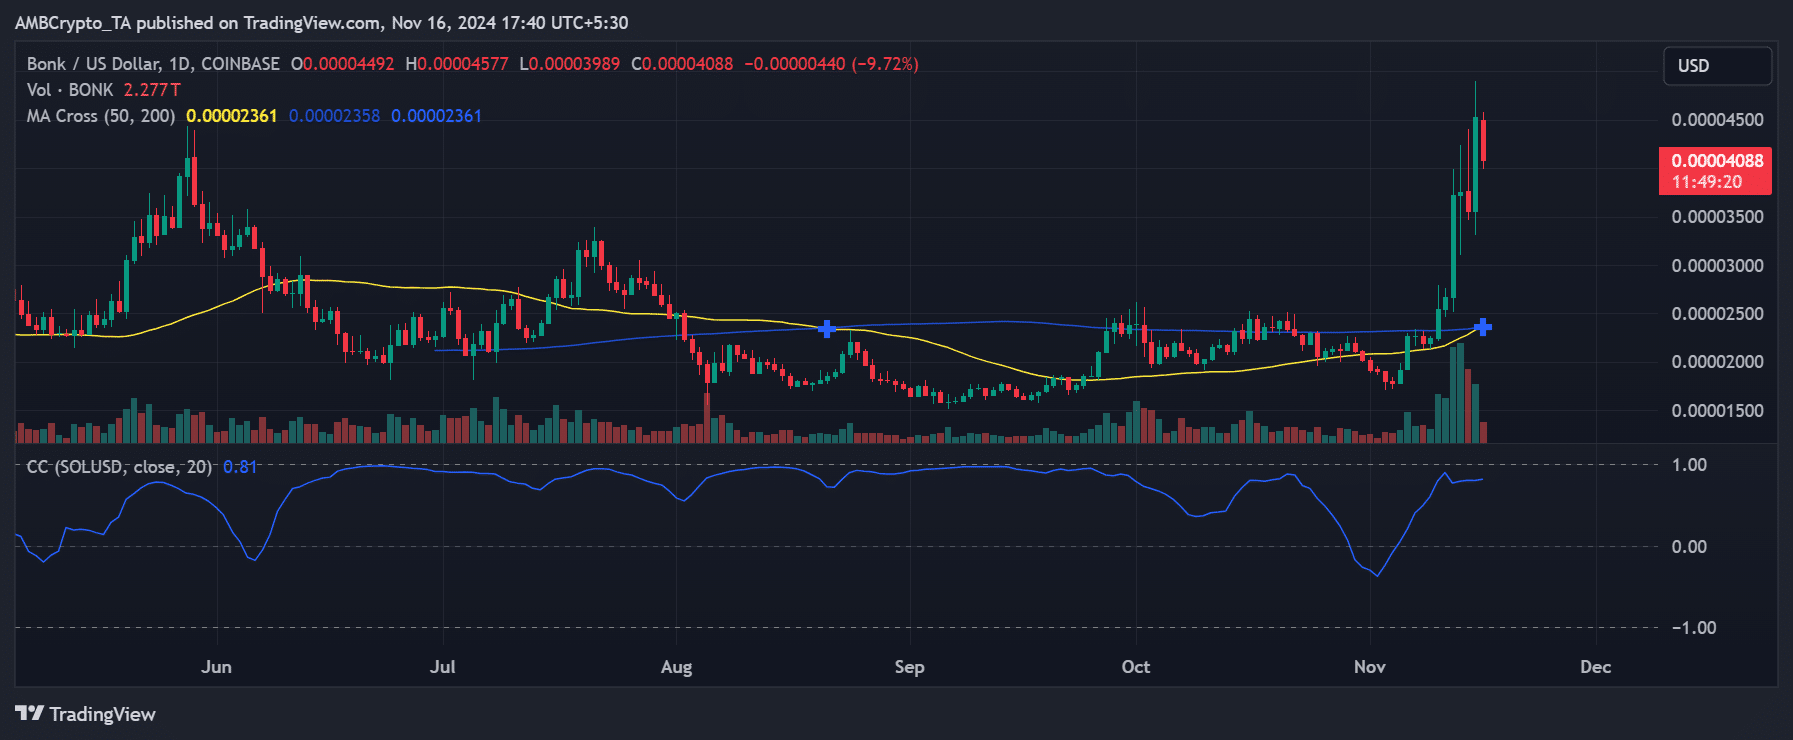
BONK’s meteoric rise can also be closely tied to Solana’s recovery in the broader market.
A correlation coefficient (CC) of 0.82, as seen in the charts, highlights this relationship. As Solana’s price trends upwards, BONK mirrors its movement, benefiting from the overall optimism surrounding the ecosystem.
Solana itself has shown resilience, with renewed developer activity and higher adoption stats contributing to its upward trajectory. BONK’s success further highlighted Solana’s ecosystem strength, bolstering its position in the highly competitive blockchain landscape.
Outlook for BONK
The combination of a rising market cap, robust trading activity, and a golden cross seemed to paint a positive picture for BONK. While short-term corrections may occur, the memecoin’s close correlation with Solana may position it for further growth.
– Is your portfolio green? Check out the BONK Profit Calculator
As BONK continues to capture market attention, traders and investors should remain cautious of volatility. However, with critical levels in focus and technical indicators aligning, BONK could see more uptrends.


