- OM has surged by 8354.87% over the past year, outpacing other coins in the market
- Market indicators suggested Mantra’s market may be overheated now and might decline
Over the past year, Mantra [OM] has recorded an explosive surge on the charts, outperforming all cryptocurrencies. In fact, in 2024, Mantra surged from a low of $0.043 to a new all-time high of $4.6, recorded 2 weeks ago.
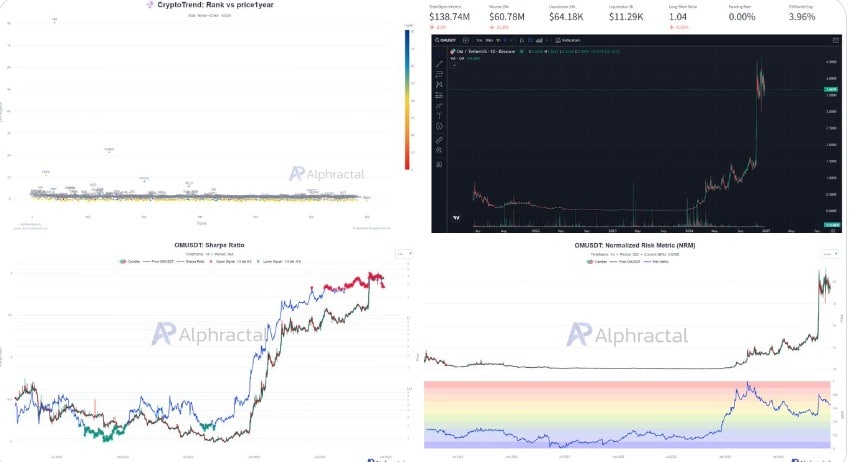
Since then, it has registered a slight pullback on the charts. At the time of writing, OM was trading at $3.65. This marked 8354.87% hike over the past year. This parabolic yearly rally has left Mantra as the best-performing crypto of the year.
MANTRA – The altcoin that dominated 2024 with +8354% Growth
According to Aphractal, OM has outperformed all major coins over the past year. For instance, the altcoin has outperformed Ethereum [ETH] by 196.5 times and Bitcoin [BTC] by 67 times.
This growth is significant for Mantra as it reflects not only the strength of the Mantra ecosystem, but also the rising demand for its blockchain.
This also is evidence that markets are warming up to blockchains that cater to real-world asset integration and are compliant with regulatory authorities. Therefore, with strong metrics and a unique vision, OM has established itself as the most impactful altcoin of the year.
What lies ahead for OM ?
Throughout 2024, Mantra has made considerable strides towards market adoption, especially as it creates a name in a highly competitive market. With this in mind, it’s essential to ask ourselves what lies ahead for OM and whether it can sustain these gains.
According to AMBCrypto’s analysis, Mantra’s market is currently overheated and the altcoin may soon be entering a corrective phase.
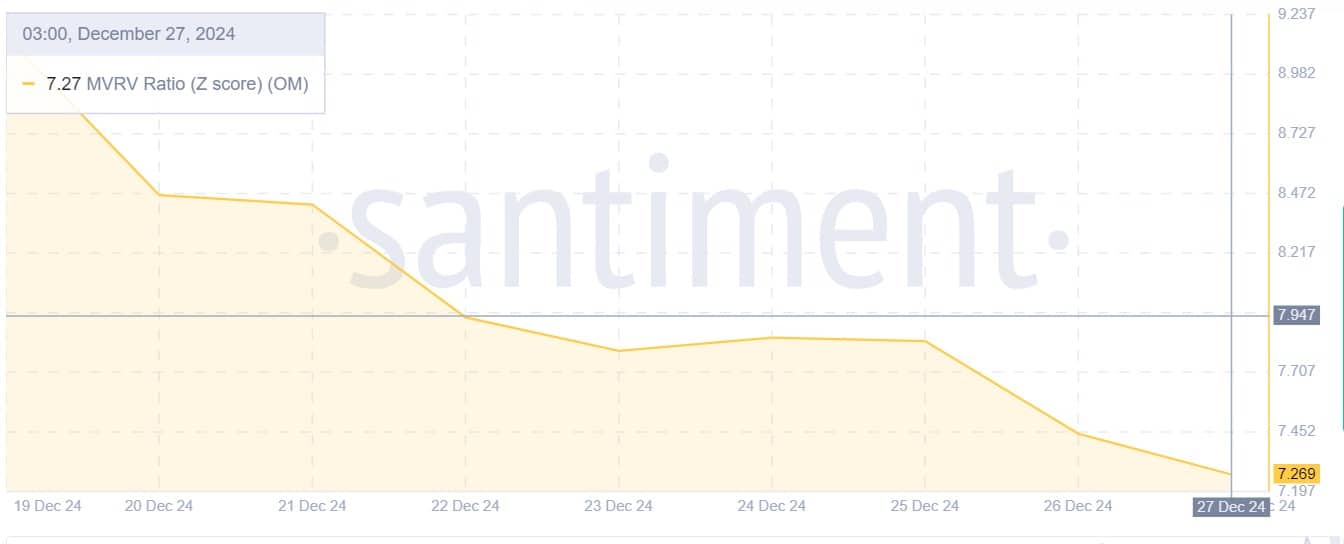
For starters, we can see this overheated signal through its MVRV Ratio Z score. While it declined from 9 to 7.2 over the past week, indicating the start of the market cooling down, it still remains in the elevated zone.
Usually, a score above 3.7 signals that market value is significantly above the realized value, which often precedes market correction or drops. Therefore, the price is most likely to decline for markets to enter a healthy state.
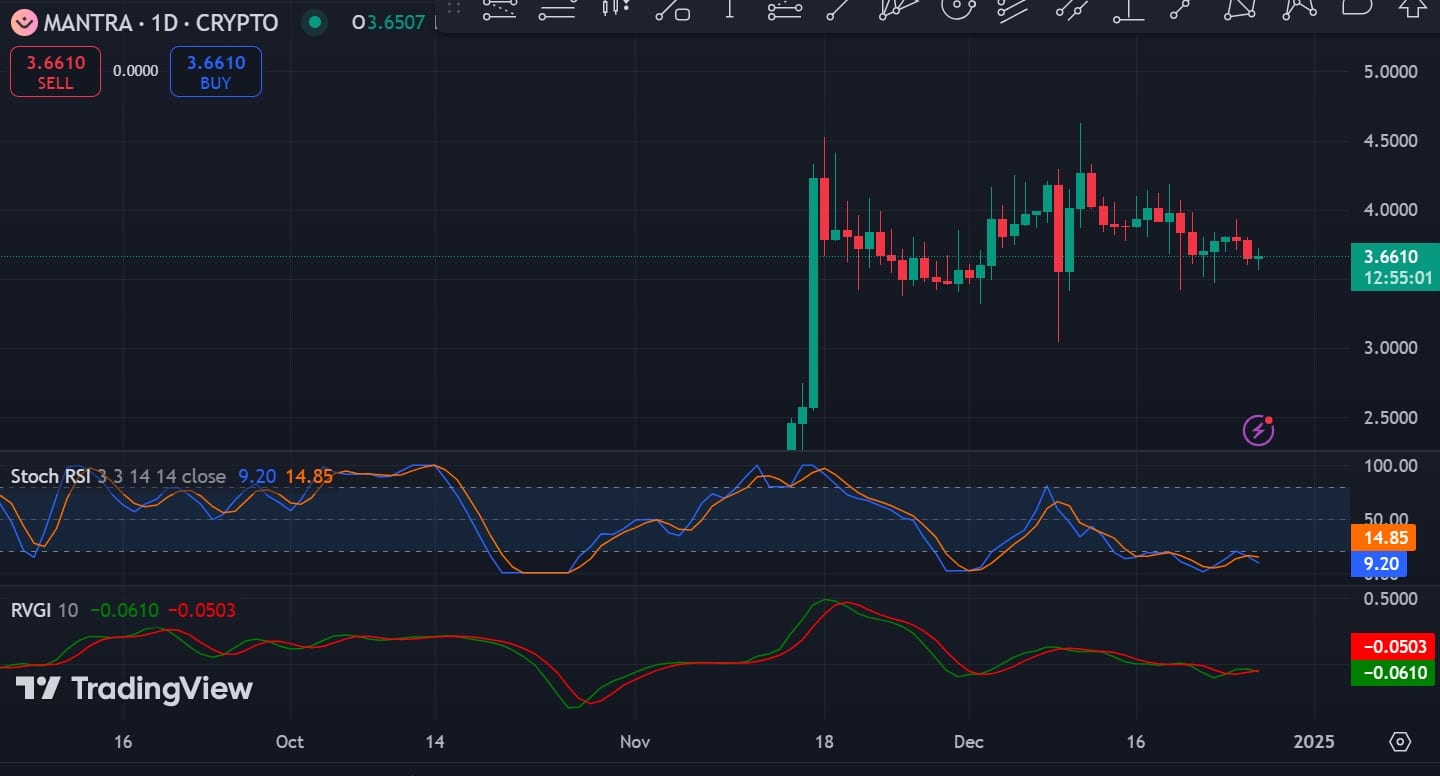
Additionally, this shift to a correction phase can be further evidenced by a bearish crossover from two fronts. As such, a bearish crossover appeared on Stoch RSI and RVGI. When this crossover appears on Stoch, it suggests that upward momentum has weakened and the price may decline.
This bearishness can be further confirmed by the bearish crossover on the Relative Vigor Index (RVGI).
In conclusion, bears are entering the market and trying to take over. If their attempts succeed, OM could see losses on its price charts. If the observed bearish trend persists, OM could drop to $3.4. However, if the yearly trend holds its might, the altcoin will reclaim the $4.0 resistance.

![2024 saw OM [Mantra] outperform the rest, will 2025 be any different?](https://hamsterkombert.com/wp-content/uploads/2024/12/2024-saw-OM-Mantra-outperform-the-rest-will-2025-be.webp.webp)


